GBP/USD -Rebounded from cloud chart support zone at bottom end of cloud! Old highs next key resistance zones! GBPUSD Chart
Top end of cloud is also the next key support zone to watch!
Friday 30 June 2017
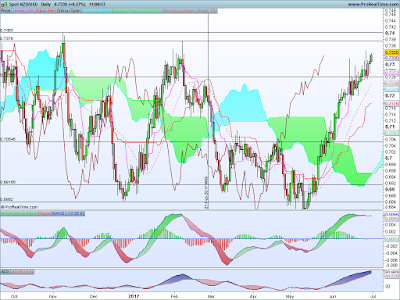
NZD/USD -Grinding higher towards old high resistance levels.
NZD/USD -Grinding higher towards old high resistance levels around: 0.7374/76 key resistance zones! NZDUSD CHART
USD/CAD -Fighting for support at significant old lows!
USD/CAD -Fighting for support at significant old lows and old cloud chart support levels! 1.2968 key level!
USDCAD Chart
USDCAD Chart
ULTRAPRO QQQ -Rebounded from old lows.
ULTRAPRO QQQ -Rebounded from old lows and cloud chart support zone at bottom end of cloud! Critical support levels! Critical day to see if support will hold, and we get a rebound from here, if not, there is more downside risk! TQQQ Chart
SPDR S&P500- Rebounded from old high support levels
SPDR S&P500- Rebounded from old high support levels, but downside risk remains towards bottom end cloud level:238! Critical day today to see if support around these levels will hold!
SPY Chart: SPY Chart
SPY Chart: SPY Chart
Thursday 29 June 2017
Wednesday 28 June 2017
Gold USD -So far so good, found support at top end of weekly cloud.
Ounce Gold USD -So far so good, found support at top end of weekly cloud chart. 1250 major support zone! Weekly gold chart.
Crude Oil Full0817 Future-The bottom of the barrel?
Crude Oil Full0817 Future-The bottom of the barrel might just be at old low support levels: 41.36/39.32 zone! Chart Link: WTI Chart
Brent Crude Oil Full0817 Future -Fighting for support.
Brent Crude Oil Full0817 Future -Fighting for support at old cloud chart support zone at bottom end of the cloud!
Chart Link: Brent Crude Chart
Chart Link: Brent Crude Chart
Monday 26 June 2017
S&P500 Index -Slow grind higher
S&P500 Index -Slow grind higher, with consolidation risk towards the top end front cloud support zone!
Chart link: S&P500 Chart
Chart link: S&P500 Chart
FTSE 100 : Consolidating!
FTSE 100 index consolidating, with downside risk towards the top end cloud chart support zone! Looking for a rebound on that level if support holds!
DAX30 Perf Index -Consolidating
DAX30 Perf Index -Consolidating, with downside risk towards the top end cloud chart support zone!
http://rt7.t.prorealtime.com/ProRealTimeNew/display_chartimage.phtml?name=jykmmb83nlayw1yrs5hcvo3z4&type=png&purpose=share_twitter
DAX Chart
http://rt7.t.prorealtime.com/ProRealTimeNew/display_chartimage.phtml?name=jykmmb83nlayw1yrs5hcvo3z4&type=png&purpose=share_twitter
DAX Chart
Wednesday 21 June 2017
S&P 500 Cloud Chart ETF Market & Sector Review:
S&P 500 Cloud Chart ETF Market & Sector Review: 21st June 2017
Cloud Chart market review of the SPY ETF and subsectors. Key support and resistance levels identified from a cloud chart trading perspective.
Cloud Chart market review of the SPY ETF and subsectors. Key support and resistance levels identified from a cloud chart trading perspective.
Thursday 8 June 2017
S&P 500 Cloud Chart ETF Market & Sector Review:
S&P 500 Cloud Chart ETF Market & Sector Review: 8th June 2017
Cloud Chart market review of the SPY ETF and subsectors. Key support and resistance levels identified from a cloud chart trading perspective.
Tuesday 6 June 2017
GBP/USD -Having a hard time to get past cloud chart resistance
GBP/USD -Having a hard time to get past cloud chart resistance at bottom end of the cloud!
Slow grind into the cloud, but not making much progress , bottom end cloud resistance appears to be far to much for GBPUSD to deal with!
GBPUSD Chart
Slow grind into the cloud, but not making much progress , bottom end cloud resistance appears to be far to much for GBPUSD to deal with!
GBPUSD Chart
EUR/USD -Fighting old cloud chart resistance levels
EUR/USD -Fighting old cloud chart resistance levels on weekly cloud chart!
http://rt1.e.prorealtime.com/ProRealTimeNew/display_chartimage.phtml?name=d996w6qdp4dfb224lpbl24xs2&type=png&purpose=share_twitter
http://rt1.e.prorealtime.com/ProRealTimeNew/display_chartimage.phtml?name=d996w6qdp4dfb224lpbl24xs2&type=png&purpose=share_twitter
http://rt1.e.prorealtime.com/ProRealTimeNew/display_chartimage.phtml?name=d996w6qdp4dfb224lpbl24xs2&type=png&purpose=share_twitter
http://rt1.e.prorealtime.com/ProRealTimeNew/display_chartimage.phtml?name=d996w6qdp4dfb224lpbl24xs2&type=png&purpose=share_twitter
Subscribe to:
Posts (Atom)


