Thursday, 30 March 2023
Wednesday, 29 March 2023
FTSE100 Futures: AI generated Swing trade signal on 4H chart still active in the FTSE100 futures contract. Keep a tight volatility adjusted training stop active! Winning with AI!
FTSE100 Futures: AI generated Swing trade signal on 4H chart still active in the FTSE100 futures contract. Keep a tight volatility adjusted training stop active! Winning with AI!

So far so good artificial intelligence generates great high probability trades on the FTSE 100 Index futures contract.

On average the AI Major Reversal AI signal is about 70% accurate on average, and the Swing trade one 68% on average. Winning with AI!
Xetra Dax Index: Waiting patiently for the next high probability AI generated trade on the Xetra Dax index futures contract on the 3 hour chart!
Xetra Dax Index: Waiting patiently for the next high probability AI generated trade on the Xetra Dax index futures contract on the 3 hour chart!
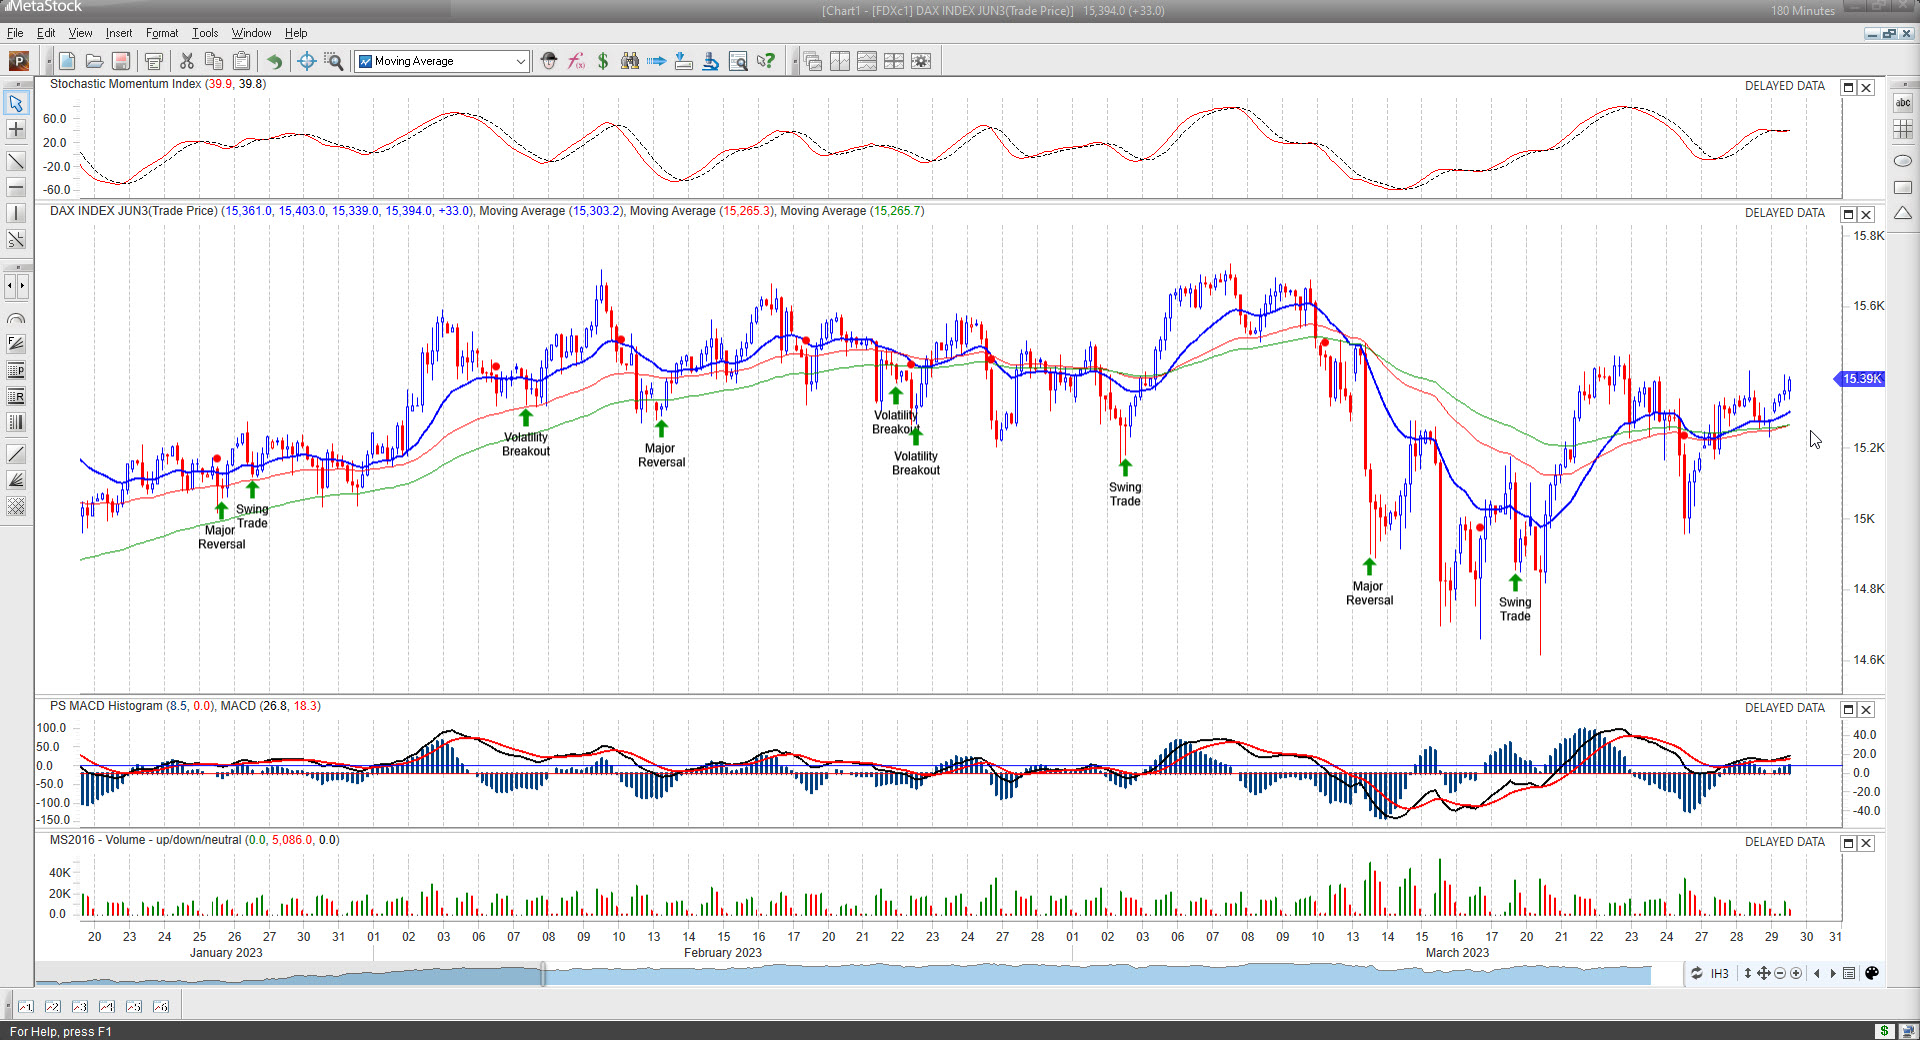
So far so good artificial intelligence generates great high probability trades on the Dax futures contract.
On average the AI Major Reversal AI signal is about 70% accurate on average, and the Swing trade one 68% on average. Winning with AI!

Tuesday, 28 March 2023
Monday, 27 March 2023
Friday, 24 March 2023
Bitcoin BTCUSD Up by more than 70% since the VB AI buy signal! Now hitting 28800 resistance zone consolidation risk remain high here!
Bitcoin BTCUSD Up by more than 70% since the VB Artificial Intelligence (AI) buy signal! Now hitting 28800 resistance zone consolidation risk remain high here!
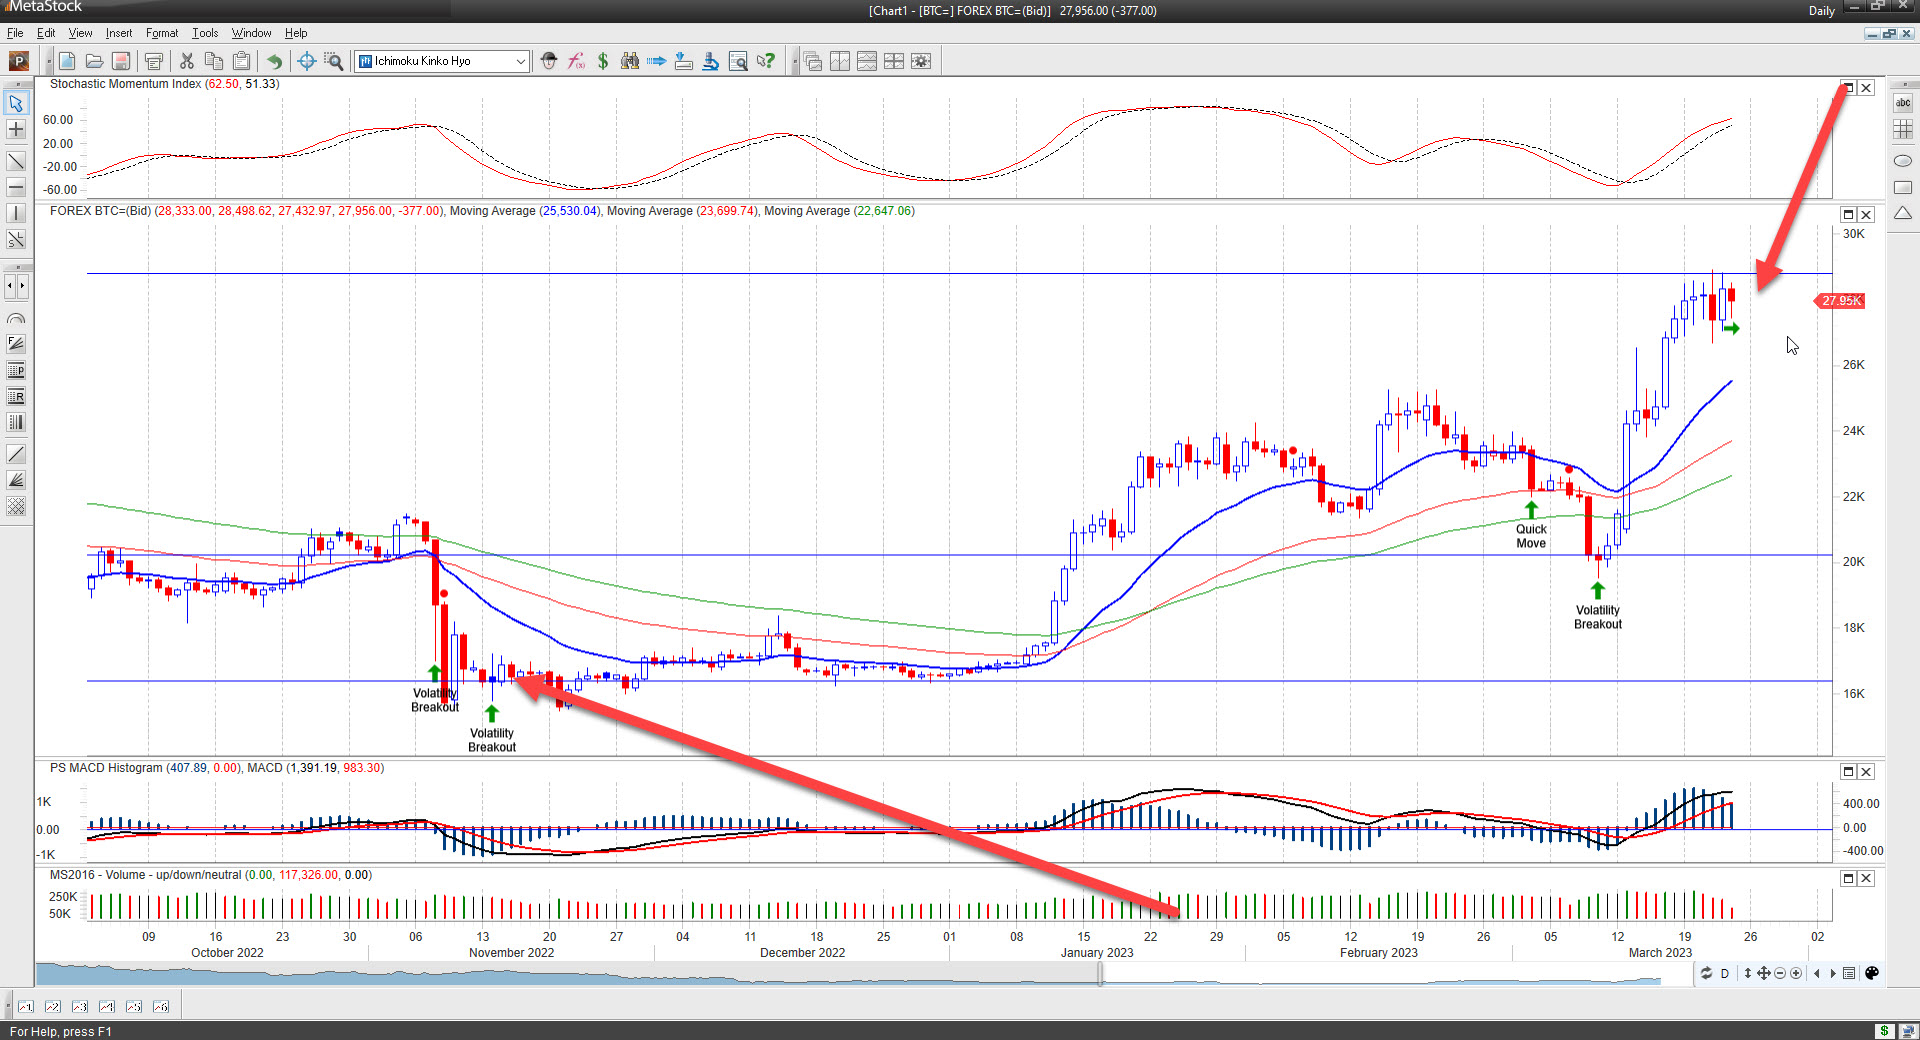
The weekly chart shows the 28800 resistance where BTC needs to break past! Critical week ahead!

Thursday, 23 March 2023
Wednesday, 22 March 2023
PALO Palo Alto Networking: VB & ST Artificial Intelligence Trade signals are generating some great trades in PALO!
PALO Palo Alto Networking: Volatility Breakout & Swing trades Artificial Intelligence Trade signals are generating some great trades in PALO! So far so good. Winning with AI!

Arista Networks ANET: Great rallies after the VB AI trade signals! Now moving into profit taking zone!
Arista Networks ANET: Great rallies after the VB Artificial Intelligence (AI) trade signals! ANET bit extended now and moving into profit taking zone! Consolidation risk remain high here!

Nvidia NVDA up more than 122% since the AI buy signal! Now moving into profit taking resistance zone between $276/$289. Keeping trailing stop tight here!
Nvidia NVDA up more than 122% since the Artificial Intelligence (AI) buy signal! Now moving into profit taking resistance zone between $267/$289. Keeping trailing stop tight here! Winning with AI!


Tuesday, 21 March 2023
Monday, 20 March 2023
Xetra Dax Index: After more than a 900 point drop since the CC sell signal the Dax is fighting hard to rebound from a key CC support zone of 14484/14571. Rebound rally coming if support holds!
Xetra Dax Index: After more than a 900 point drop since the Cloud Chart (CC) sell signal the Dax is fighting hard to rebound from a key CC support zone of 14484/14571. Rebound rally coming if support holds!

S&P500 Index futures: Rebounded from 3900 zone now fighting hard to break past top end CC resistance: 3945!
S&P500 Index futures: Rebounded from 3900 zone now fighting hard to break past top end Cloud Chart (CC) resistance: 3945! Need to see a sustained breakout past this CC resistance zone, that will be very bullish from a CC perspective! Critical week ahead!

Downside risk remains in place towards the bottom end of the front end of the cloud!
FTSE100 Index: Fighting hard for support at a 7292/7225 CC support zone! Rebound rally coming if support holds at this range!
FTSE100 Index: Fighting hard for support at a 7292/7225 Cloud Chart (CC) support zone! Rebound rally coming if support holds at this range!
This comes soon after hitting a sell signal when the FTSE100 lost support at the bottom end of the cloud! The other major sell signal was around the 8000 zone and then again at 7600 zone.
If support holds can see a rebound relief rally towards the upside resistance zones of 7438/7587 and the bottom end of the CC at 7675.

Risk remain in place since price action is below the cloud and that remains bearish long-term on the daily CC chart. Short-term rebound swing trades are the best strategy around support levels.
So far so good the FTSE100 is testing support at a critical CC level on the weekly CC. Rebound potential here if support holds.

CS Group: Credit Suisse down more than 92% since CC sell signal! Fat cat bankers make great shorts!
CS Group: Credit Suisse down more than 92% since CC sell signal! Fat cat bankers make great shorts!
CS group down by more than 92% on both the two most recent sell signals using the Cloud Chart trading algorithm!

Wednesday, 15 March 2023
S&P500 Index futures rebounded from CC support target 3809! Now fighting hard for support at 3847/3839 CC support zone! Rebound potential if support holds!
S&P500 Index futures rebounded from CC support target 3809! Now fighting hard for support at 3847/3839 CC support zone! Rebound potential if support holds!

Rebound swing trade from these key levels back up to the next upside resistance zone of 3914/3918/3926 if support holds!
Downside risk to retest the 3809 CC support zone if support fails at 3839! Risk remain high since price action is below the Cloud!
Xetra Dax: Down more than 700 points since the CC resistance zone sell signal! Rebounded from front cloud support at 14727! Critical to stay above this key support zone!
Xetra Dax: Down more than 700 points since the Cloud Chart (CC) resistance zone sell signal! Rebounded from front cloud support at 14727! Critical to stay above this key support zone!
Rebound support zones at 14790/14727/14659. Critical that the Dax remains above these levels!

FTSE100: Down more than 5% since the CC sell signal, now fighting hard for support at a key CC support zone: 7463/7450!
FTSE100: Down more than 5% since the Cloud Chart (CC) sell signal, now fighting hard for support at a key CC support zone: 7463/7450! Rebound potential if support holds!

But beware price action still below the Cloud and that remains bearish. Swing trades rebound trades below the Cloud best options forward!
On the daily CC FTSE100 is testing old CC support zone, critical for support to hold here, for a potential rebound. If support fails then the downside risk is towards the next CC zone of 7156/7111!

Monday, 13 March 2023
SVB Financial: After more than 9 Cloud Chart Sell signals over past 16 months, it went bust! The warnings were there! Beware the "con in Silicon Valley stocks!
SVB Financial: After more than 9 Cloud Chart Sell signals over past 16 months, it went bust! The warnings were there!
Bad management, over leveraged and price action below the Cloud confirmed the long-term negative outlook at the time!
Beware the "con" in Silicon Valley stocks!

Thursday, 9 March 2023
Wednesday, 8 March 2023
Coca-Cola FEMSA KOF ADR: Having a great +40% rally since the Artificial Intelligence MR and VB trade signals!

Using Cloud Chart (CC) analysis in combination with AI generates great returns! Using the VB signal with a CC rebound support trade offered a double confirmation of the potential upside in the CC. Moving into profit taking zone for the MR signal!
Dicks Sporting Goods DKS: Having a great rally since the Artificial Intelligence MR and VB trade signals!
Dicks Sporting Goods DKS: Having a great rally since the Artificial Intelligence Major Reversal (MR) and Volatility Breakout (VB) trade signals! Using Cloud Chart (CC) analysis in combination with AI generates great returns! Using the VB signal with a CC rebound support trade offered a double confirmation of the potential upside in the CC.

https://www.metastock.com/alphaharvestf
US 2Y T-Note: J Powell Power Yield Party keeps going as yields hitting the 4.47% then 4.65% then both the 4.87% and 4.95% P&F chart target! Next targets 5.27%/5.525% Risky times!
US 2Y T-Note: J Powell Power Yield Party keeps going as yields hitting the 4.47% then 4.65% then both the 4.87% and 4.95% P&F chart target! Next targets 5.27% / 5.525% Risky times!
A P&F chart reversal to the downside will signal the of the current rally! Consolidation risk in and around recently met targets!

US 10Y T-Note: J Powell Power Yield Party keeps going as yields hitting the 4% P&F chart target! Next targets 4.17%/4.2% and 4.3% to 4.45% Risky times!
US 10Y T-Note: J Powell Power Yield Party keeps going as the yield hitting 4% P&F chart target! Next targets 4.17% / 4.2% and 4.3% to 4.45% Risky times!

Friday, 3 March 2023
Alteryx AYX : Up by more than 56% since the Volatility AI generated trade signal! Winning with AI!
Alteryx AYX : Up by more than 56% since the Volatility AI generated trade signal! Winning with AI!
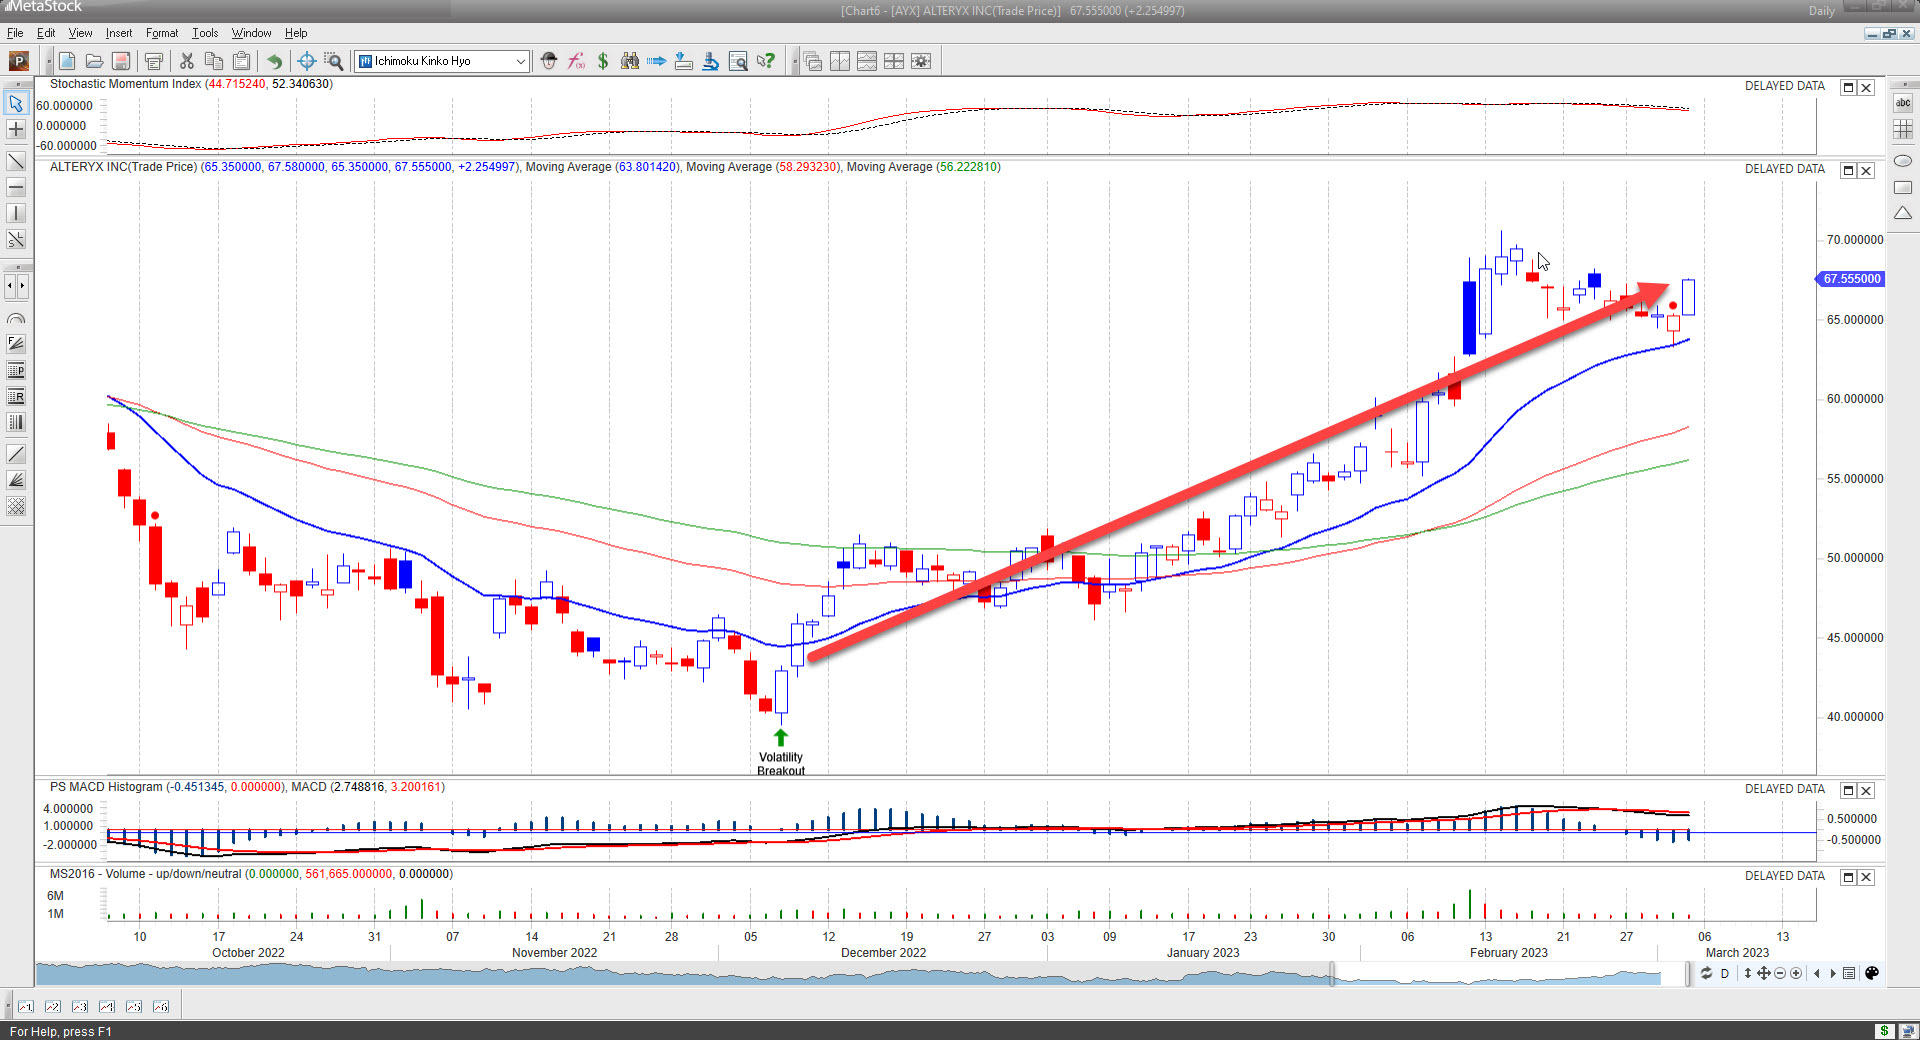
For more AI info go to : https://www.metastock.com/alphaharvestf
Samara Inc IOT Great + 72% rally since the AI swing trade buy signal! Winning with AI!
Samara Inc IOT Great rally since the artificial intelligence ( AI) swing trade buy signal! Winning with AI!
Up by more than 72% in just a few weeks. Now moving into profit taking zone!
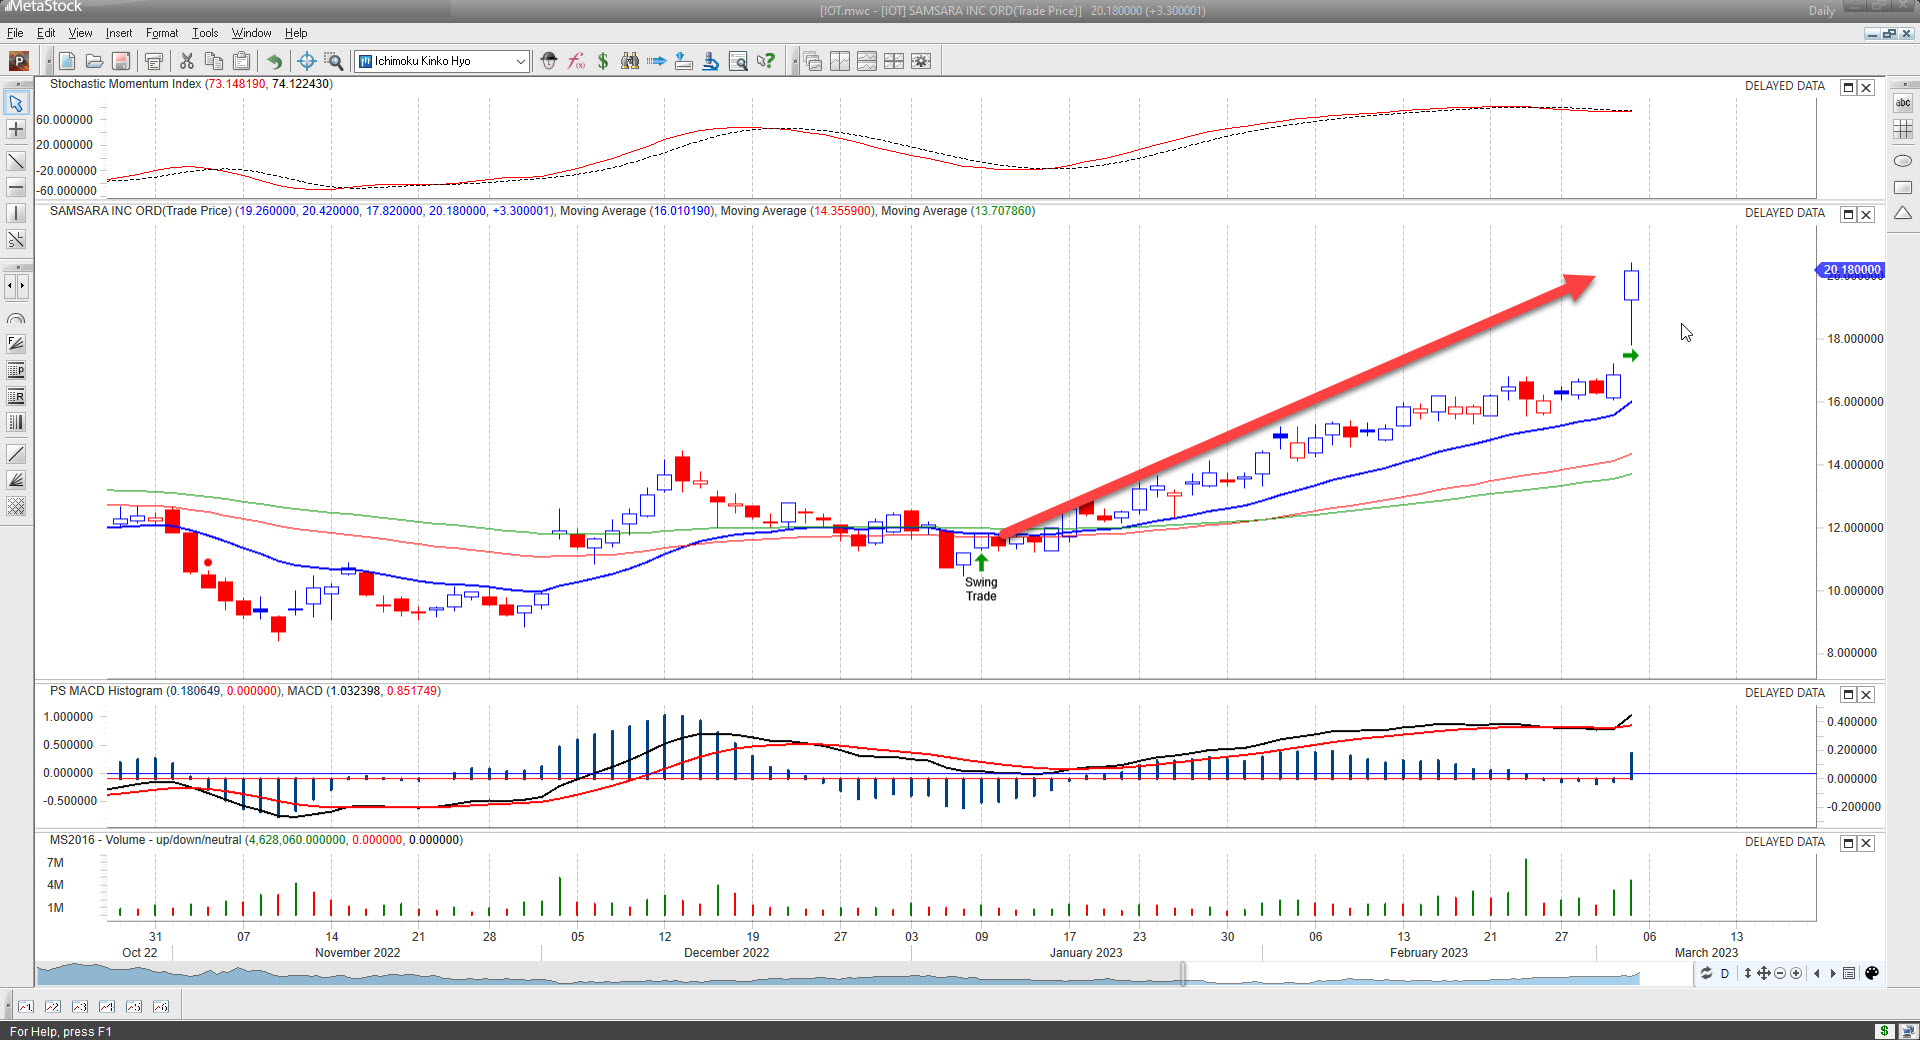
For more AI info go to : https://www.metastock.com/alphaharvestf