S&P500: At a critical cloud chart resistance zone:2905/2860!
S&P500 index is up about 30% since the rebound from old cloud chart support levels of Q4 2017, 2197 zone! On the daily cloud chart the index is now at an old cloud chart resistance zone of 2904.27/2680.71 resistance zone! Need to see a sustained breakout from these levels for the rally to motor ahead! But downside consolidation risk remain high at these levels.
On the weekly cloud chart the S&P500 is hitting another key cloud chart resistance zone at the top end of the cloud, 2923/2904 another key resistance zone! Critical for the index to break past this zone, if not and resistance holds then there is more downside to the market!
Critical week ahead!
Wednesday 29 April 2020
Tuesday 28 April 2020
Tesla TSLA: After a 58% rally, now at a key cloud chart resistance zone!
Tesla TSLA: After a 58% rally since the buy signal, TSLA is now at a key cloud chart resistance zone of 795! Critical week ahead to see if TSLA will remain above this key level. Yesterdays close at 798.75 is above this critical cloud chart resistance zone!
Consolidation risk remain high here after such a strong rally!
Consolidation risk remain high here after such a strong rally!
Monday 27 April 2020
Xetra Dax Index: Grinding into cloud chart resistance! Resistance target: 11025!
Xetra Dax Index: Grinding into cloud chart resistance! Resistance target: 11025!
Critical week ahead as the Dax grinds deeper into cloud chart resistance! Reversal risk remain high here after a 20% rally since the buy signal!
11025 is a key line in the sand resistance zone!
Critical week ahead as the Dax grinds deeper into cloud chart resistance! Reversal risk remain high here after a 20% rally since the buy signal!
11025 is a key line in the sand resistance zone!
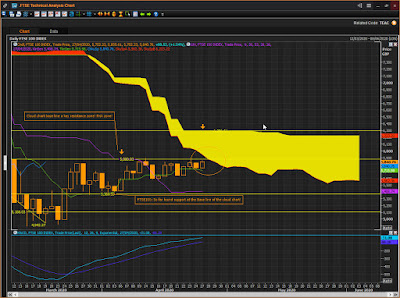
FTSE100: Grinding towards two key resistance zones:5880/5877
FTSE100: Grinding towards two key resistance zones:5880/5877
Need to see a breakout past these two cloud chart resistance levels:
Reversal risk remain high here if resistance holds!
If the FTSE manages to breakout past this zone then the next target will be 6296 the top end cloud chart resistance! Critical week ahead!
Need to see a breakout past these two cloud chart resistance levels:
- 5880 base line resistance, and
- 5877 a key cloud chart resistance at the bottom end of the cloud!
Reversal risk remain high here if resistance holds!
If the FTSE manages to breakout past this zone then the next target will be 6296 the top end cloud chart resistance! Critical week ahead!
Wednesday 22 April 2020
NDX-Nasdaq-100 ran into front cloud chart resistance around 8902 zone!
NDX-Nasdaq-100 ran into front cloud chart resistance around 8902 zone!
Next support zone is at the base line of the cloud at 8254 on the weekly cloud chart.
Turning to the daily cloud chart: The NDX reversed lower after hitting the resistance zone at 8935/8902! Old cloud chart resistance zone!
Now the next key level to watch for a rebound is at the top end of the cloud support zone: 8254! If support holds NDX should rebound from here. If support fails at this level, then the next level is 7825 zone, a combination of the base line and close to the bottom cloud chart support zone.
The good news is that price action is back above the cloud! Thats bullish!
Monday 20 April 2020
Xetra Dax: Grinding higher towards next resistance zone: 11025!
Xetra Dax: Grinding higher towards next resistance zone at the top end of the cloud: 11025!
Current rally will run into significant resistance at this zone! Reversal risk remain high!
Current rally will run into significant resistance at this zone! Reversal risk remain high!
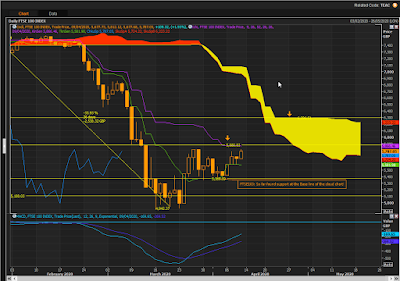
FTSE100: Close to cloud chart base line resistance zone: 5880!
FTSE100: Close to cloud chart base line resistance zone: 5880!
Need to see a breakout past this resistance zone for the FTSE to move to next target at the top end cloud chart resistance zone of 6296!
Critical week ahead for a breakout! If resistance holds, then there is more downside to come!
Need to see a breakout past this resistance zone for the FTSE to move to next target at the top end cloud chart resistance zone of 6296!
Critical week ahead for a breakout! If resistance holds, then there is more downside to come!
Thursday 16 April 2020
DJI: Fighting hard to get past critical cloud chart resistance zone:23835
DJI: Fighting hard to get past critical cloud chart resistance zone:23835. Need to see the Dow break past this level with a sustained rally!
If resistance holds then there is more downside. DJI at a critical stage here!
If resistance holds then there is more downside. DJI at a critical stage here!
S&P500: Having a hard time to stay above a key cloud chart resistance zone:2794
S&P500: Having a hard time to stay above a key cloud chart resistance zone:2794.
Need to see a sustained breakout past this level for the rally to hold. If not, then there is downside back down to the bottom cloud support zone at 2540!
Need to see a sustained breakout past this level for the rally to hold. If not, then there is downside back down to the bottom cloud support zone at 2540!
Monday 13 April 2020
S&P500: Critical week ahead, fighting cloud chart resistance at 2793!
S&P500: Critical week ahead, fighting cloud chart resistance at 2793!
Critical week ahead to see if the S&P500 will blast past this key front cloud chart resistance zone! Downside risk remain high here for this is a significant resistance level to get past!
If resistance fails, then the next support zone to be tested will be the bottom end of the cloud at 2540!
Critical week ahead to see if the S&P500 will blast past this key front cloud chart resistance zone! Downside risk remain high here for this is a significant resistance level to get past!
If resistance fails, then the next support zone to be tested will be the bottom end of the cloud at 2540!
Thursday 9 April 2020
FTSE100: Next key resistance level to test: 5880, then 6296, top end cloud chart resistance!
FTSE100: Next key resistance level to test: 5880, then 6296, top end cloud chart resistance!
FTSE100 bear market relief rally underway with the cloud chart base line of 580 the next key resistance zone to test. If the FTSE can blast past this resistance, the next key level to watch is the top end of the cloud chart level 6296!
Currently the relief rally is under way, but we are still trading in bear market territory since price action is below the cloud!
German Xetra Dax 30 Index: Next key resistance zone at top end of the cloud: 11025
German Xetra Dax 30 Index: Next key resistance zone at top end of the cloud chart: 11025.
Critical to see if the Dax will reverse lower at this level, or break past resistance. This is a bear market rally since price action is below the cloud , and that is still bearish!
But despite that, the relief rally is up more than 19% since the rebound form old cloud chart support lines!
Critical to see if the Dax will reverse lower at this level, or break past resistance. This is a bear market rally since price action is below the cloud , and that is still bearish!
But despite that, the relief rally is up more than 19% since the rebound form old cloud chart support lines!
Monday 6 April 2020
DJI: Critical week ahead to see if the rebound from the cloud chart will continue!
DJI: Critical week ahead to see if the rebound from the top end of the monthly cloud chart support level ( 20971/21287) will continue!
As long as the DJI stays above the bottom end cloud chart support zone, the relief rally will remain intact.
Upside target the bottom end of the cloud on the weekly chart. But this will be a long and slow grind.
As long as the DJI stays above the bottom end cloud chart support zone, the relief rally will remain intact.
Upside target the bottom end of the cloud on the weekly chart. But this will be a long and slow grind.
Xetra Dax: Found support at the base line of the cloud chart:9185!
Xetra Dax: Found support at the base line of the cloud chart:9185!
So far so good, as long as the Dax stay above this level the recen buy signal remains active!
So far so good, as long as the Dax stay above this level the recen buy signal remains active!
FTSE100: So far so good, found support at the base line of the cloud:5369!
FTSE100: So far so good, found support at the base line of the cloud chart:5369! Expect the index to grind higher as long as this support level holds!
Wednesday 1 April 2020
S&P500: Fighting hard for support at 2486: top end cloud chart support zone!
S&P500: Fighting hard for support at 2486: top end cloud chart support zone on the monthly cloud chart. Potential rebound zone, but if support fails then the next two levels for support are at the next key cloud chart levels: 2375/2304!
Subscribe to:
Posts (Atom)


