Thursday 29 October 2020
Wednesday 28 October 2020
Xetra Dax Index: Lost support at cloud chart level, price action below the cloud: outlook bearish!
Xetra Dax Index: Lost support at cloud chart level, price action below the cloud: outlook bearish!
Price action below the daily cloud chart level and this is bearish on a daily cloud chart.
Old support targets are 12090/11741 and then 11562, old cloud chart shadow support levels to be tested!
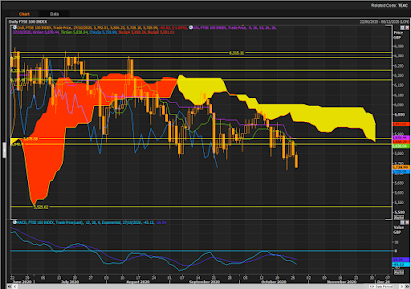
FTSE100 Trading below weekly cloud, remains bearish long-term!
FTSE100 Trading below weekly cloud, remains bearish long-term!
FTSE100 price action is below the cloud on a weekly basis and this remains bearish! Cloud chart zone is a key resistance zone!
Downside support levels on daily cloud chart are 5525! Downside risk to these key levels!
Tuesday 27 October 2020
BTCUSD: Bitcoin hit three P&F chart targets! Consolidation risk remain high here!
BTCUSD: Bitcoin hit three P&F chart targets! Consolidation risk remain high here!
BTC hit 12800 then 13200 then 13400 point and figure chart targets! Next target is 14300 but not without a consolidation of recent gains at around these P&F chart targets!
Beware any P&F chart reversal that will signal the end of the rally around target levels!
BTCUSD: Up +25% and moving into profit taking zone!
BTCUSD: Up +25% and moving into profit taking zone!
BTC is up 25% since the most recent algo buy signal! Now bit extended from the cloud and moving into profit taking zone! Consolidation risk remain high!
Monday 26 October 2020
Friday 23 October 2020
Wednesday 21 October 2020
Monday 19 October 2020
Friday 16 October 2020
DJI: Dow Jones 30 index consolidating recent gains!
DJI: Dow Jones 30 index consolidating recent gains!
DJI became a bit extended on a low volume rally above the cloud! Top end cloud chart support levels to watch are 28320, the Base Lines support level of 28149, and then the top end of the cloud as the 3rd major support zone:27866. Price action above the cloud on 4H and that bullish so far.
Swing trades from cloud chart support levels!
Thursday 15 October 2020
TSLA Grinding higher after clearing the 3rd cloud chart buy zone!
TSLA Grinding higher after clearing the 3rd cloud chart buy zone!
TSLA, "the carbon credit trading business with a car company on the side" is grinding higher after the last few weeks cloud chart buy points!
Cloud chart rebound buy zones around 344/387! Then the next rebound from the top end cloud chart support zone at 416!
Trade 1: up 34%
Trade 2: up 19%
Trade 3: up 10%
Upside resistance target zone is around 498/500!
Very very risky stock, high beta stock, very expensive/overpriced, but it is a pure bubble momentum trade!
Wednesday 14 October 2020
$SPX Bang! Hit the P&F chart target zone of 3550!
$SPX Bang! Hit the P&F chart target zone of 3550 few days ago! Up more than 276 points since the rebound from P&F chart support! Beware P&F chart reversal risk here after this strong rally. Next target 3625 but not without a consolidation on the way there!
$AMZN up 14% since the most recent AI signal!
$AMZN up 14% since the most recent AI (artificial intelligence) signal! Now getting closer to the old high target. So far so good for AMZN prime day! Expect more volatility as now closer to old high level!
$DDOG Up 28% since the P&F chart buy signal.
$DDOG Up 28% since the P&F chart buy signal. Met 106 &107 P&F targets recently. Next P&F chart target 120! So far so good. Beware any P&F chart reversal to signal end of trend!
Monday 12 October 2020
NDX-100: On its way to next P&F chart target: 11980!
NDX-100: On its way to next P&F chart target: 11980!
After rebounding from key support levels the NDX is now grinding higher towards the next P&F chart target of 11980! Beware any 60 point reversals to the downside that could signal the end to the current trend!
S&P500: Next P&F chart target 3550!
S&P500: Next P&F chart target 3550!
Slow grind higher, but so far so good!
Beware any 75 point move to the the downside will signal an end to the trend!


