Thursday 31 August 2017

FANG stocks: Sharpening teeth again!


FANG stocks: Consolidating, potential rebound towards old high resistance zones!

FB:
Slow grind higher, with old high of $175 as next key resistance target!


AMZN:
Rebounding from 21 EMA within a consolidation base. Upside potential towards old high resistance zone!


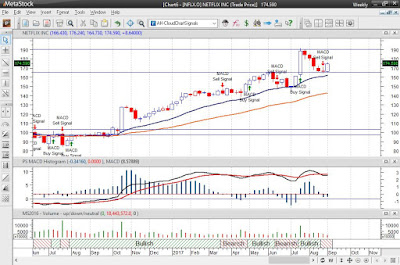
NFLX:
Rebounding from old high support zones and the 21 EMA. Upside potential towards old high resistance zones!

 Google: Alphabet.
Rebounding from 21 EMA, upside potential toward old high resistance zones!


EURUSD: Running into old resistance levels!

EURUSD: Running into old resistance levels!

From the weekly, there old lows around the 1.20 zones that are major resistance.
Slow grind into this resistance, and now consolidating.
Downside risk to key moving averages. But consolidation risk remain!


TQQQ on its way to test old high resistance zones!

ULTRAPRO QQQ -Rebounded from cloud support at 103. Now on its way to test next key resistance zones: 113.50/115! Close to profit taking zone!


Tuesday 29 August 2017

EURUSD: On its way to test old resistance levels!

EURUSD: On its way to test old resistance levels as per weekly chart.
Key resistance level is: 1.2058.
Expect a consolidation of recent gains around this level.
www.metastock.com/alphaharvesti

GBP/USD -Fighting for support at cloud level!

GBP/USD -Fighting for support at top end of the cloud! Key support zone! 

If support holds here, we can expect a rebound. Downside risk remain towards bottom end of the cloud!


EUR/USD grinding higher towards next key resistance zones!

EUR/USD -Grinding higher, with next key cloud chart resistance levels at:1.2160/1.22330! 


Gold Full1217 Future -broke past old resistance levels.

Gold Full1217 Future -broke past old resistance levels. Now testing cloud chart resistance at 1318. Upside potential towards next cloud resistance level of 1340! 

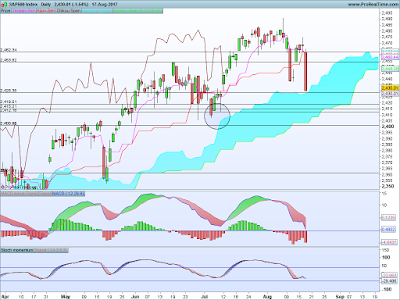
S&P500 Index -Fighting for support at top end of the cloud!

S&P500 Index -Fighting for support at top end of the cloud! Downside risk towards bottom of cloud remain in place!  Cloud is a key support zone!

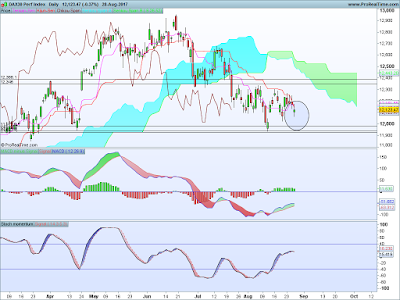
DAX30 Perf Index -On its way to test old cloud chart support levels

DAX30 Perf Index -On its way to test old cloud chart support levels at 11974! Already testing 12000 levels.

FTSE-100: In trouble, trading below the cloud!

FTSE100 Index -Trading below the cloud. Cloud levels are key resistance zones! Downside Risk remains high!

Friday 25 August 2017

Wednesday 23 August 2017

TQQQ: Great rebound from 103 support zone! Target 111/113

TQQQ: Great rebound from 103 support zone! Next upside resistance target 111/113.


www.metastock.com/alphaharvest

USDDKK: Fighting hard for support at old support zone!

USDDKK: Fighting hard for support at old support zone! Old weekly chart support levels of 6.31 being tested for potential trend change. Outlook remain bearish, and looking out for the next cloud chart trading signal. Patience!

USDCHF: Rebounded from cloud pivot support. Outlook: Bullish.

USDCHF: Rebounded from cloud pivot support:0.9599. Outlook: Bullish.
Next key resistance zone at : 0.9773 resistance levels.

www.metastock.com/alphaharvest

USDCAD: Cloud chart outlook bullish.

USDCAD: Cloud chart outlook recently changed to bullish. Upside potential to old resistance levels.  Old support levels remain support zone for potential further rebound.
www.metastock.com/alphaharvest

AUDUSD:Bearish outlook, downside risk towards old support.

AUDUSD: Bearish outlook, downside risk towards old support levels.
www.metastock.com/alphaharvest

NZDUSD: Recent cloud chart outlook changed to bearish.

NZDUSD: Recent cloud chart outlook changed to bearish. Cloud sell signal remain in place, with downside risk towards old support levels!

www.metastock.com/alphaharvest

Tuesday 22 August 2017

S&P 500 SPDR and SPDR sector cloud chart market review.


Cloud chart analysis of the S&P 500 index SPY ETF, as well as the subsectors. Key support and resistance levels are identified on a cloud chart basis. (Apologies for the sound quality, there are some minor problems with the sound)

GBPUSD: Consolidating after hitting resistance. Downside risk=1.28/1.26

GBPUSD: Consolidating after hitting resistance. Downside risk=1.28/1.26 Cloud chart outlook has changed from bullish to bearish recently. Downside risk remain high!


EURUSD: Consolidating around key resistance levels!

EURUSD: Consolidating around key resistance levels of 1.17/1.18. Profit taking is in order after a strong rally. Watching closely for the outlook to change to bearish!

CADUSD: Rebounded from old support! Outlook changed:Bullish.

CAD/USD: Rebounded from old support levels. Cloud chart outlook changed to bullish.

AUDUSD: Consolidating, outlook changed to bearish.

AUDUSD: Consolidating, outlook changed to bearish. After a strong rally AUD rand into old resistance levels. a consolidations is now underway, and we just recently had a sell signal on a cloud chart basis. Downside risk towards old highs for support.


Monday 21 August 2017

ULTRAPRO QQQ -On its way to test support at 103

PROSHARES ULTRAPRO QQQ -On its way to test support at 103 cloud chart support zone! 

Potential rebound zone here at the top end of the cloud. Downside risk towards bottom cloud level.


SPDR S&P 500- fighting for support at top end cloud chart support zone!

SPDR S&P 500- fighting for support at top end cloud chart support zone! Downside risk towards bottom cloud level.

DJ30 Industrial Avg Index -Fighting for support at 21681

DJ30 Industrial Avg Index -Fighting for support at 21681, downside risk to cloud support at 21535! Potential rebound zone at key cloud chart support levels at top end of the cloud!


DAX30 Perf Index -Fighting for support!

DAX30 Perf Index -Fighting for support, but downside risk towards old lows remain in place! Close to rebound zone!

The index is trading close to potential rebound zone, but the overall outlook is not very positive. There is upside potential back up to the bottom cloud chart resistance zone! Front cloud is still trending down!


FTSE100 Index -Fighting for support at old lows

FTSE100 Index -Fighting for support at old lows, critical week! Bottom of the cloud is new resistance zone!

Friday 18 August 2017

TQQQ on its way to first major support zone!

TQQQ is on its way to first major support zone:103, critical level for potential ST rebound.

NASDAQ-100 EQUAL WEIGHTED index in trouble

NASDAQ-100 EQUAL WEIGHTED index in trouble,price action below cloud.Testing 3200 support levels! Risk towards 3142!
Need to see support coming in here at 3200, or else we heading down towards 3142. Problem now is that price action is below the cloud, so it confirms the downtrend. Bottom of the cloud is now the new resistance zone!

DJ30 Index-downside risk towards key support zones

DJ30 Index-downside risk towards key support zones:21688/21534! Top of cloud chart next support zone! 

S&P500 Index - On its way to test support at top end of the cloud:

S&P500 Index - On its way to test support at top end of the cloud: 2428! Potential rebound zone at cloud support. If support holds at this level, I expect a rebound from cloud chart support zone! Downside risk towards bottom cloud level remain in place. Critical day!


Wednesday 16 August 2017

G10 FX Cloud Chart market outlook:

G10 FX Cloud Chart market outlook.

A review of the cloud chart signals of the G10 FX pairs.

}AUD/USD


}EUR/USD


}GBP/USD


}NZD/USD


}USD/CAD


}USD/CHF


}USD/DKK


}USD/JPY


}USD/NOK


}USD/SEK
Key support and resistance zones are discussed for each FX pair.


Monday 14 August 2017

USDJPY on its way to test 108.15 support zone!

USDJPY on its way to test 108.15 support zone! Outlook is still bearish, and looking for support to come in. Monitoring it for the reversal signal.

www.metastock.com/alphaharvest3for1 

GBPUSD consolidating after hitting old resistance highs at 1.32 zone!


GBPUSD consolidating after hitting old resistance highs at 1.32 zone! Next key support level around 1.2850! Critical week ahead!


www.metastock.com/alphaharvest

EURUSD fighting old resistance at 1.1844 zone!

EURUSD fighting old resistance at 1.1844 zone! Watching for the profit taking signal around these levels. Been a strong rally up to here, but now fighting old resistance levels that comes from the weekly cloud chart. Critical week ahead!
www.metastock.com/alphaharvesti

S&P500 Index -On its way to test support at cloud levels!

S&P500 Index -On its way to test support at top end of the cloud 2428 support zone!  Looking for a rebound at cloud chart levels when support comes into the market.


NASDAQ100 Index -Fighting for support!

NASDAQ100 Index -Fighting for support at front cloud support level:5787 zone! Expect rebound from cloud support.

FTSE100 Index in trouble!

FTSE100 Index in trouble:lost support at bottom cloud chart support zone! Need to see support come in at 7316 zone! 

Friday 11 August 2017

TQQQ key support levels to watch $103/$97!

TQQQ key support levels to watch $103/$97! Today could see a test of the 55 day moving average! Critical level to test for support!


TQQQ: on its way to test support at top end cloud chart level!

TQQQ: on its way to test support at top end cloud chart level!

Top end of the cloud is the next key level to be tested. Potential rebound zone if support comes in at these levels. Downside risk to test next level of support at bottom of cloud! Critical week ahead next!


SPDR S&P 500 -On its way to test for support at top end cloud chart support zone!

SPDR S&P 500 -On its way to test for support at top end cloud chart support zone! 


Gold USD -On its way to test old high resistance levels!

Ounce Gold USD -On its way to test old high resistance levels! 


NASDAQ100 Index - On its way to test for support at key cloud chart levels!

NASDAQ100 Index - On its way to test for support at key cloud chart levels!


Thursday 10 August 2017

NASDAQ100 Index: On its way to test front cloud support!

NASDAQ Indices US - NASDAQ100 Index - On its way to test support at front cloud support zone: 5854. Downside risk towards bottom cloud support zone at 5788 remain in place!

NASDAQ-100 EQUAL WEIGHTED -Fighting for support

NASDAQ-100 EQUAL WEIGHTED -Fighting for support at top end of the cloud! consolidation underway!

DJ30 Industrial Avg Index -Consolidation risk increasing!

DJ30 Industrial Avg Index -Consolidation risk towards top end front cloud support zone: 21831. 

FTSE100 Index -Consolidation risk high.

FTSE100 Index -Consolidation risk high, next level of support at top end of cloud chart support zone! 

Wednesday 9 August 2017

Bitcoin BTC.X Fighting for support at bottom end cloud

$BTC.X Fighting for support at bottom end cloud support zone on 60m chart! In trouble here as price is below cloud!


The daily Bitcoin chart show that the old highs are now the new support zone levels. Consolidation risk remain down to test these highs, and then another rebound from support in around these levels.