Friday 29 October 2021
Thursday 28 October 2021
Wednesday 27 October 2021
TSLA trades up 74% and 50% as TSLA hitting those upside P&F chart targets of 1000/1040!
TSLA trades up 74% and 50% as TSLA hitting those upside P&F chart targets!
Two of the most recent point&figure chart trades are up 74% and 50% respectively! TSLA also hitting the upside targets of 910/960 and then 1000 and 1040! The next targets are 1140/1340, but beware any P&F chart consolidation and reversal risk around key targets! Great rally so far!
Thursday 21 October 2021
TSLA up +51% since the Point&Figure chart buy signal! Hit the 860 and now 880 targets!
TSLA up +51% since the Point & Figure chart buy signal! It hit the 860 and now 880 P&F chart targets!
Next targets are 910/960, but do expect some consolidation of recent price moves. Beware any P&F chart revesals to signal the end of the current trend.
So far so good!
Wednesday 20 October 2021
Bitcoin Hit another P&F chart target: 63750! Next target 64500/65750!
Bitcoin Hit another P&F chart target: 63750! Next target 64500 and 65750! A great performance since the rebound P&F chart buy signal around the 31250 zones!
Beware any P&F chart reversals and consolidations in and around these P&F chart targets!
Nasdaq-100 Hit the 15400 point&figure chart target! +3200 point rally!
Nasdaq-100 Hit the 15000 then the 15400 point&figure chart target! +3200 point rally since the most recent P&F chart trend line rebound buy signal.
Next targets are 16800 and then 18500, but do expect reversals and consolidations along the way to targets!
S&P500 Index hit the 4500 point&figure chart target! A 170 point rally!
S&P500 Index hit the 4500 point&figure chart target! A 170 point rally since the P&F chart buy signal. Two higher targets are at 4665 and 4685, but beware any consolidations and P&F chart reversals at these elevated levels!
Tuesday 19 October 2021
Friday 15 October 2021
Thursday 14 October 2021
Wednesday 13 October 2021
Tuesday 12 October 2021
TSLA up 38% since the last AI swing trade signal!
TSLA up 38% since the last AI (artificial intelligence) trade signal!
So far so good TSLA up 38% since the AI swing trade signal! Winning with AI!
Monday 11 October 2021
Friday 8 October 2021
Thursday 7 October 2021
Bitcoin hitting upside point and figure chart targets! Up 32% since buy signal!
Bitcoin hitting upside point and figure chart targets! Up 32% since buy signal!
BTC recently met the upside point and figure chart targets of 55250 and 55500! Beware any consolidation risk at these levels after such a strong rally. BTC is up more than 32% since the P&F buy signal!
Wednesday 6 October 2021
Tuesday 5 October 2021
Monday 4 October 2021
Friday 1 October 2021
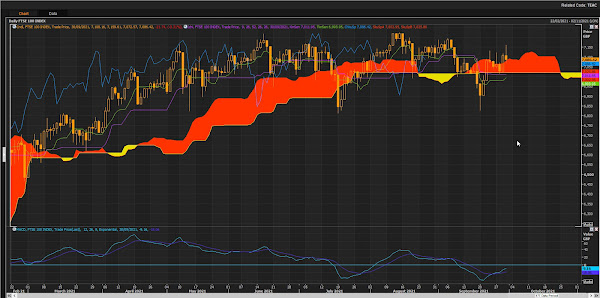
FTSE100 Fighting for support at the top end of the cloud! Downside Risk: 7019!
FTSE100 Fighting for support at the top end of the cloud!
FTSE100 fighting for support at the top end of the cloud. There is downside risk towards the bottom end cloud chart support zone at 7019! Critical for the FTSE100 to remain above this zone for the rally to remain in place! Any price action below the bottom end of the cloud will change the outlook to bearish from bullish!
Xetra Dax Index Remain Bearish Since Trading Below The Cloud!
Xetra Dax Index Remain Bearish Since Trading Below The Cloud!
Price action remain below the cloud and the outlook remain bearish when this is the case. Downside support targets are drawn on the chart, where potential rebounds can take place. But for the rally to resume price needs to be above the cloud!
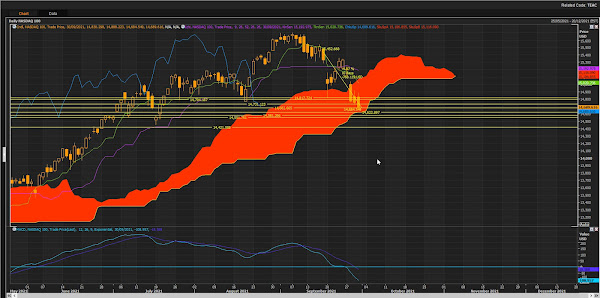
NDX Bearish Outlook on 4 Hour Cloud Chart! NDX is down 4.97% (-768 points) since the cloud chart sell signal!
NDX Bearish Outlook on 4 Hour Cloud Chart!
NDX is down 4.97% (-768 points) since the cloud chart sell signal! Price action still below the cloud and outlook remains bearish on a cloud chart basis! Key cloud chart support zones are identified on the 4 hour chart.
On the daily cloud chart there is a key support zone at bottom end of the cloud at 14622, if support fails and the NDX trades below the cloud then the NDX is in a correction too with outlook remaining bearish! Need to see support come in at that level, otherwise the rally is over!
S&P500 Index In Correction Mode On Daily Cloud Chart! Bearish Outlook!
S&P500 Index In Correction Mode On Daily Cloud Chart! Bearish Outlook!
S&P500 closed below the bottom end of the daily cloud and this puts the index in correction mode. Downside risk is high now since the outlook is bearish as long as price action is below the cloud!
On the 4 hour cloud chart the index is still bearish since the cloud chart sell signal above the cloud! S&P500 is dowm more than 4% since the cloud chart sell signal!
Subscribe to:
Posts (Atom)


