Wednesday, 28 December 2022

TSLA: "In Musk We Trust" Trade reached the next downside Cloud Chart (CC) targets of 127/109! TSLA down +65% since the CC sell/short signal!

TSLA: "In Musk We Trust" Trade  reached the next downside Cloud Chart  (CC)  targets of 127/109! TSLA down +65% since the  most recent CC sell/short signal! This comes soon after hitting downside targets of 195/180/161 and 127!

There is downside risk to the next Cloud Chart Targets  (CC) of 90 & 66 if support does not come back into the stock at key CC support zones! Price action below the Cloud remains bearish long-term! Looking out for a CC rebound reversal at support zones to signal the end of the trend.


TSLA also hit the downside P&F chart targets of 177/156/153/147 and more recently the 117 target. Getting close to the next 108 target! Looking out for a P&F chart reversal to the upside to signal the end of the current trend! 


On the monthly CC downside targets met were 213/156, with a cluster support zone at 95/93 & 89 old Cloud Chart support zones! Potential rebound zone!


Friday, 16 December 2022

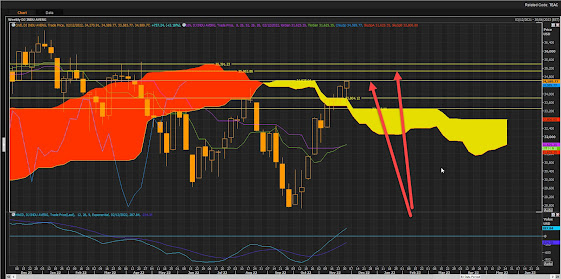
Dow Jones Industrial Index: FAT reversal after hitting Cloud Chart Resistance at 34618 zone! Downside risk towards the bottom end of the CC at 32812/32106!

 Dow Jones Industrial Index: FAT reversal after hitting Cloud Chart Resistance at 34618 zone! Downside risk towards the bottom/top end of the CC at 32812/32106! 

Two key levels for a potential rebound is the front end of the CC at 32812 to 32106! 


S&P500 Index futures pulling back after hitting Cloud Chart resistance. Downside risk to CC support zones of 3886/3839 & 3809!

 S&P500 Index futures pulling back after hitting Cloud Chart resistance. Downside risk to CC support zones of 3886/3839 & 3809!


The bottom end of the front CC support zone is a key level for a potential rebound. If price action moves below this level the outlook will change from bullish to bearish on the daily CC. Critical week ahead!

On the weekly CC we can see how significant the resistance zone is at the bottom end of the cloud!

S&P500 failed to break past the cloud! Outlook remains bearish long-term on the weekly Cloud Chart!


Thursday, 15 December 2022

TSLA: "In Musk We Trust Trade" reached downside target of 161/159 Cloud Chart (CC) support zones! TSLA down +50% since the CC sell/short signal!

TSLA: "In Musk We Trust Trade" reached downside target of 161/159 Cloud Chart (CC) support zones! TSLA down +50% since the CC sell/short signal!  


If support fails at this 161/159 zone there is downside risk towards the next CC support target of 129/91 zones! Upside resistance zones are at 195/204! 


Monday, 12 December 2022

Xetra Dax Index: After a fat +20% rebound rally the Dax ran into front Cloud Chart resistance zone 14571/14363 and now consolidating the really!

 Xetra Dax Index: After a fat +20% rebound rally the Dax ran into front Cloud Chart (CC) resistance zone 14571/14363 on the weekly Cloud Chart. Now consolidating the really! 


On the daily CC consolidation risk back down to the front end of the cloud, as well as the standard line of the cloud with major support zone at the front end of the cloud! but so far so good the Dax is above the top end cloud on the daily CC.


S&P500 Index Future: Consolidating back down to key Cloud Chart support zones after hitting 4101 resistance target! Rebound zone 3839 zone!

 S&P500 Index Future: Consolidating back down to key Cloud Chart support zones after hitting 4101 resistance target! Rebound zone 3839 zone, a major Cloud Chart support zone! Currently testing the standard line support zone for support! 


Looking out for swing trades from key support rebound zones on the Cloud Chart.


Tuesday, 6 December 2022

DJ Industrial Index: Rebound rally ran into old Cloud Chart resistance at 34625 zone. Consolidation risk down to 33804/33297 potential support zones!

 DJ Industrial Index: Rebound rally ran into old Cloud Chart resistance at 34625 zone. Consolidation risk down to 33804/33297 potential support zones!


S&P500 Index: Reversed lower after hitting Cloud Chart resistance at 4101 resistance zone!

 S&P500 Index: Reversed lower after hitting Cloud Chart resistance at 4101 resistance zone on the weekly Cloud Chart (CC).  Key CC  resistance zones are 4101/4162, with downside risk towards 3926/3882 on weekly CC. Price action below the Cloud remains bearish with rebound short-term swing trades the key trading strategy below the Cloud.


Thursday, 1 December 2022

DJ Industrial Index: Rebound rally keeps going with 34624 next key Cloud Chart (CC) resistance target!

 DJ Industrial Index: Rebound rally keeps going with 34624 next key CC resistance target! 

This comes soon after finding support at old CC support zones of 33243/33437 zones!


On the weekly CC key resistance zones  to be tested are at the 34625/35062 and 35391 zones! 

Support zones on the weekly CC are 33804/33297!


S&P500 Futures: Rebound rally keeps going as the S&P500 rebounded from Cloud Chart support zone with next key resistance zone at 4154/4186!

 S&P500 Futures: Rebound rally keeps going as the S&P500 rebounded from the front end Cloud Chart support zone of 3937/3957! Next key resistance zone at 4154/4186! Broke past the 4042 old cloud chart resistance zone. So far so good! 


S&P500 futures Cloud Chart swing trade up by more than  500 points since the rebound from 3548 support zone!