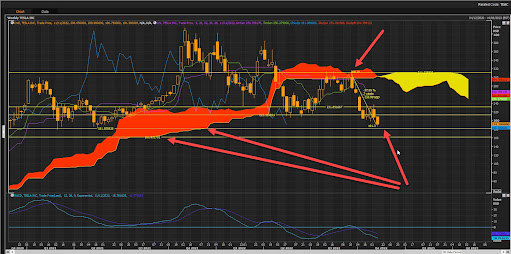
TSLA: Down 37.9% since the Cloud Chart resistance sell signal! Downside risk to 181/161 old Cloud Chart support zones!
TSLA: Down 37.9% since the Cloud Chart (CC) resistance sell signal at the top end of the weekly cloud the 311 resistance zone! The second sell signal was when TSLA sliced past the bottom end CC support zone at 298! Price action below the cloud confirmed the bearish outlook and activated the downside CC support risk targets of 213/205 and 195 with all these targets being met!
The next two key levels to keep and eye on are : 181/161 old Cloud Chart support zones!
Could see a technical rebound rally from this range of 195/181 support zones! The new risk range is between 161/181 to 213/231!
But the long-term outlook remains bearish since price action is below both the weekly and daily Cloud Charts!

No comments:
Post a Comment