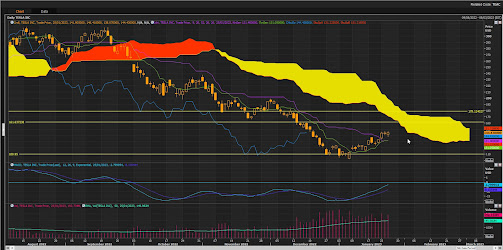
TSLA Cloud Chart Support Rebound rally up +31% after hitting support around the $109 zone! Next resistance zones to test: 150/161 and 179 if support holds. So far so good.
Key risk factor to keep an eye on is that TSLA must remain above the monthly Cloud Chart support zone to be bullish on the monthly chart. $91 remains a downside risk target if support fails!
So far both daily and weekly Cloud Charts are still bearish since price action is below the Cloud and the Cloud acts as resistance on the D & W charts. Swing trade strategies are the rebound trades from Cloud support zones back up to the bottom end of the D & W Cloud charts resistance zones!
For any long-term positions TSLA needs to trade back above the top end of the Cloud to be bullish! Trading strategy : Just the swing trades from support to resistance at the bottom end of the Cloud Chart. Quick and cheerful trades!


No comments:
Post a Comment