Friday, 2 September 2022

Nasdaq Composite: Fighting hard to rebound from the top end cloud chart support zone!

Nasdaq Composite (.IXIC): Fighting hard to rebound from the top end cloud chart support zone! 

 IXIC fighting hard to rebound from the top end of the cloud chart support zone! Vital that the index stays above the 11441 support zone! If price trades below this level of the cloud the outlook on the daily cloud chart will change to bearish from bullish! 
 Recently the IXIC rebounded from the critical support zone of 11500, only to run into trouble when it hit older resistance zones between 12351 and 13110! The trade then reached profit taking zone at these old cloud chart resistance zones! Rebound swing trade potential from this cloud chart support zone!


Long-term price action still below the cloud and this remains bearish on the weekly cloud chart! Bottom end of the cloud remains key resistance zones that can test any bullish rally!

Thursday, 1 September 2022

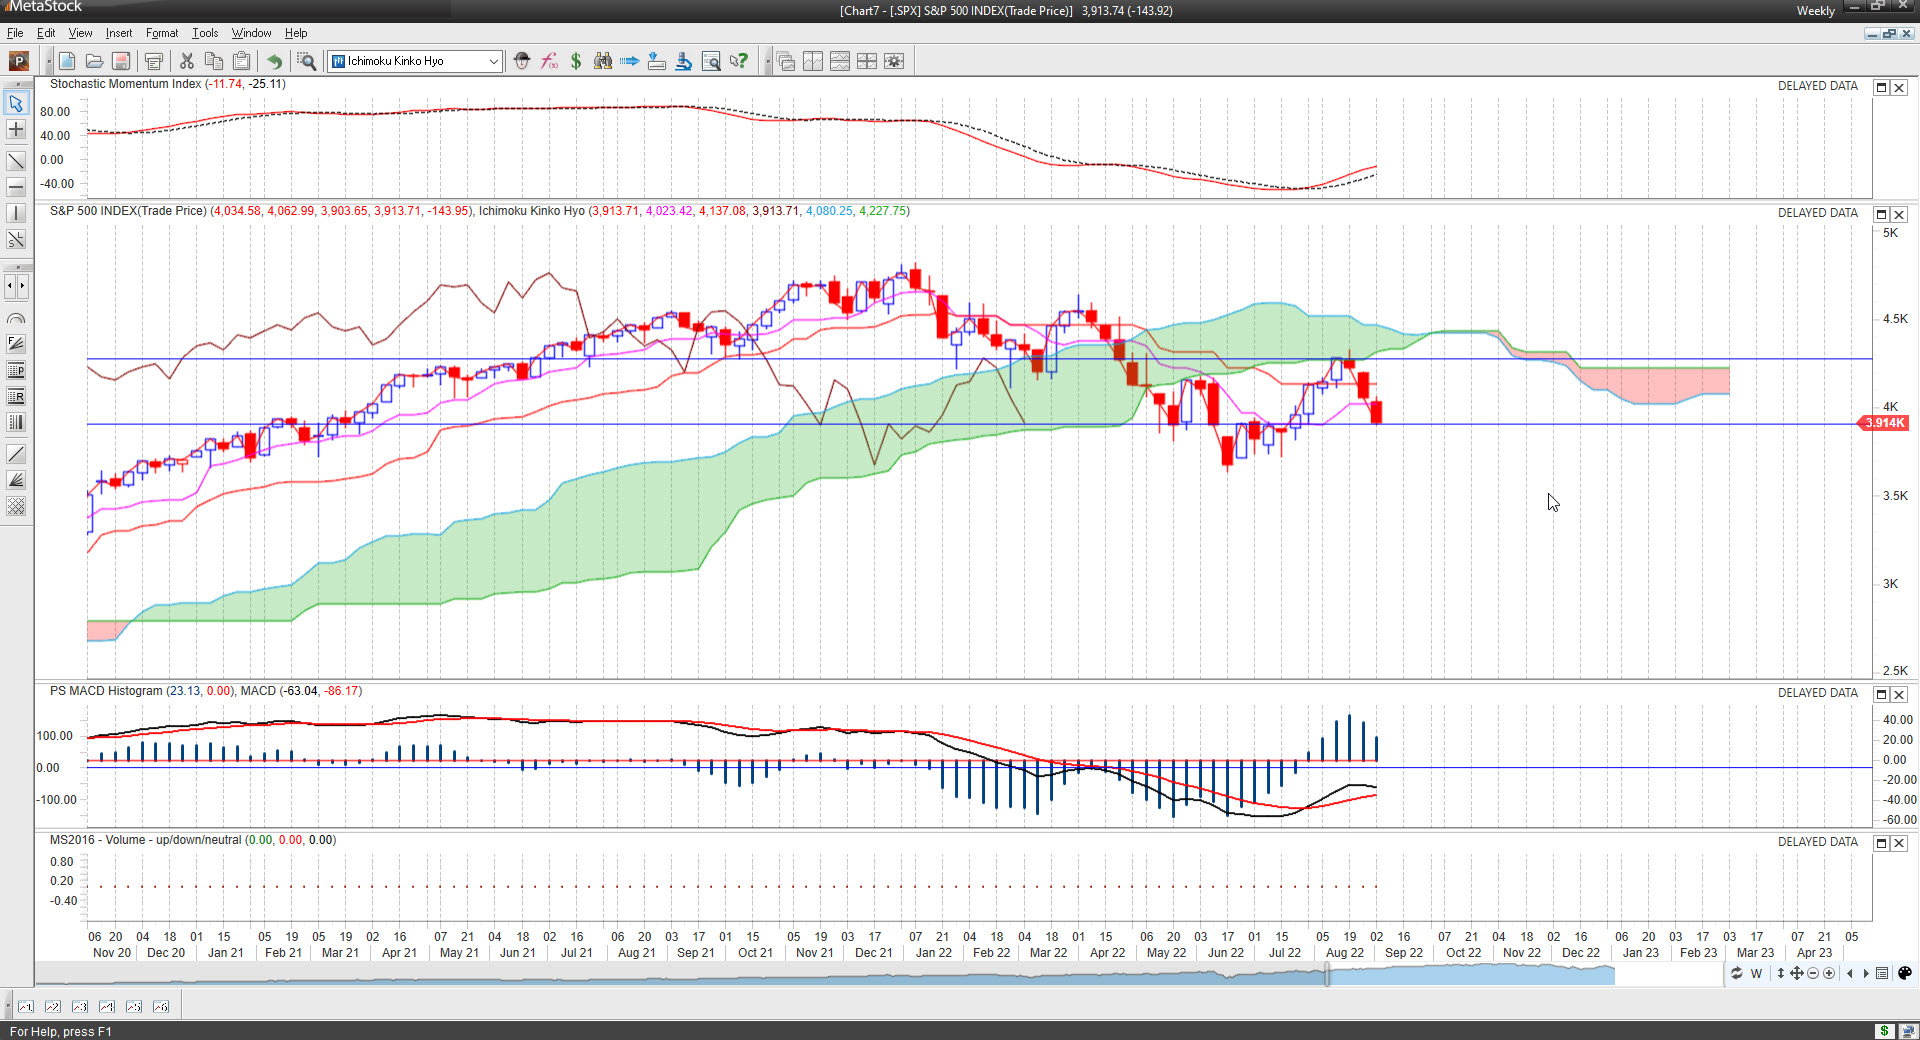
S&P500 Index Fighting hard for support at the top end of the cloud! Downside risk going up!

S&P500 Index Fighting hard for support at the top end of the cloud! Downside risk going up! Need to get a rebound from this cloud chart support zone. If support fails and the SPX closes and trades below the bottom end of the cloud outlook changes from bullish to bearish on the daily cloud chart!
Outlook remains bearish long-term on the weekly cloud chart since price action is below the cloud. There was a great swing trade rebound from old support levels back up to the bottom end of the cloud! Bottom end cloud chart resistance held and the market been selling off since hitting that zone!

Wednesday, 31 August 2022

Monday, 1 August 2022

TSLA up 39% since the Cloud Chart Support Rebound Trade. Now fighting resistance at key cloud chart levels!

TSLA up 39% since the Cloud Chart Support Rebound Trade. Now fighting resistance at key cloud chart levels of 890/891! Need to see a breakout past the 891 top end cloud chart resistance zone with the next key resistance zones at old cloud chart levels of 917 to 926 zones!
On the weekly cloud chart TSLA is now fighting a major resistance zone at the bottom end of the cloud chart! Downside risk remain high if TSLA can't break past this bottom end cloud chart resistance zone!
https://www.metastock.com/alphaharvest3for1

NDX100 E-mini Futures Trades up 2150 points using Artificial Intelligence!

NDX100 E-mini Futures Trades up 2150 points using Artificial Intelligence! June has been a great month trading the NDX100 Index futures with three trades up about 2150 points using AI on the 4H charts.
https://www.metastock.com/alphaharvest3for1

NDX100: Up 16% (+1800 points) since the Cloud Chart Support Rebound Trade! Now close to key resistance zones!

NDX100: Up 16% (+1800 points) since the Cloud Chart Support Rebound Trade! Now close to key resistance zones! So far a great rebound trade! NDX broke past 12523 and 12663 resistance zones and now fighting resistance at the 12888 cloud chart zone with next key resistance at 13140/13315 zones!
On the daily cloud there is upside potential to the next key cloud chart resistance zone at 13387! As long as price action is above the top end of the cloud outlook is bullish! Downside risk to key cloud chart support levels are 12662/12299 and 11957! Consolidation risk to these levels and then a further rebound from there if support holds!

S&P500 Index: Up more than 12% (464 points) since the Cloud Chart Support Rebound trade! Next targets key cloud chart resistance zones!

 S&P500 Index: Up more than 12% (464 points) since the Cloud Chart Support Rebound trade! Next targets key cloud chart resistance zones!


S&P500 index broke past the top end cloud chart resistance zone on the daily cloud chart. Expect this level to be tested for support! The index needs to keep trading above this cloud chart level to confirm a bullish outlook on the daily cloud!

Upside resistance targets 4136, 4227 and 4270 a major resistance zone on the weekly cloud chart target!

Cloud chart support levels that can be tested are 4075/3972! Need to see the rally remain above the top end cloud chart support zone to be bullish!