
Wednesday 27 December 2017
Bitcoin USD: rebounded after hitting downside targets!
Bitcoin USD: rebounded after hitting downside targets! Bitcoin made a key P&F chart reversal, and the next new upside target is 19050.

Friday 22 December 2017
Bitcoin USD: Hitting downside P&F chart targets!
Bitcoin USD: Hitting downside P&F chart targets!
Bitcoin USD hit the 14700, then 13800, then 12600 downside point and figure chart targets!
Consolidation well underway! Need to see support to identify next targets!

Looking at the daily P&F chart, the next downside target is 11500!

Bitcoin USD hit the 14700, then 13800, then 12600 downside point and figure chart targets!
Consolidation well underway! Need to see support to identify next targets!

Looking at the daily P&F chart, the next downside target is 11500!

Thursday 21 December 2017
Bitcoin consolidating after meeting targets!
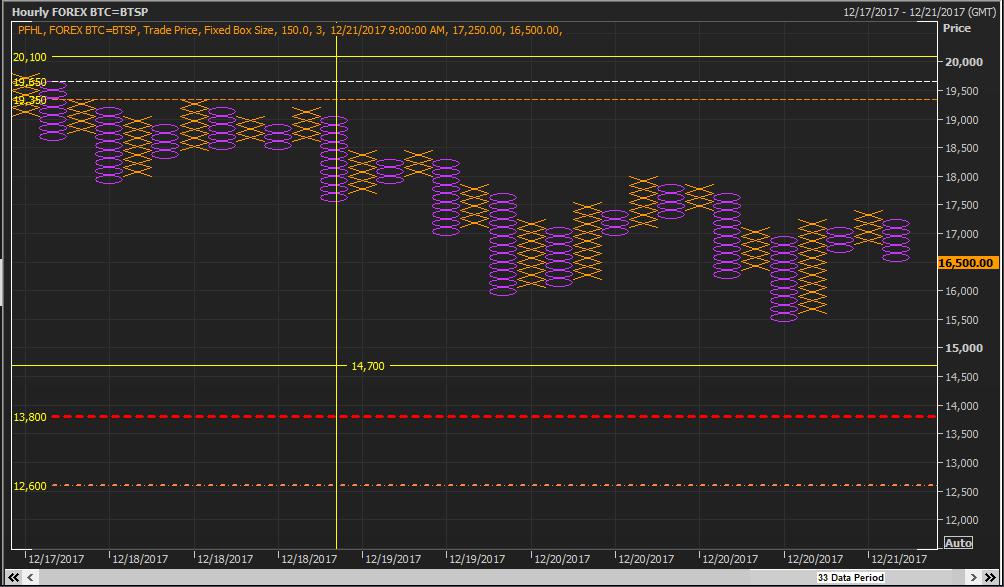
Bitcoin consilidating after meeting targets!
Now its range bound in trade after meeting the upside targets of 19650 zones.
There are a few downside targets to keep in mind on the P&F 60 min chart.
Downside risk remain to next P&F chart target of 14700.
Keeping an eye on key P&F chart reversals to signal new trend.

Now its range bound in trade after meeting the upside targets of 19650 zones.
There are a few downside targets to keep in mind on the P&F 60 min chart.
Downside risk remain to next P&F chart target of 14700.
Keeping an eye on key P&F chart reversals to signal new trend.
Big Picture Market Review
Good morning Investors.
I have done a few updates on the Dow, S&P , FTSE and Dax on twitter today!
https://twitter.com/MullerRichard
Happy trading
Regards
Richard
I have done a few updates on the Dow, S&P , FTSE and Dax on twitter today!
https://twitter.com/MullerRichard
Happy trading
Regards
Richard
Wednesday 20 December 2017
BTCUSD Bitcoin consolidating after P&F chart reversal!
BTCUSD Bitcoin consolidating after P&F chart reversal!
After a strong rally, BTC make a key P&F chart reversal, dropped 2100 after the P&F chart sell signal, and is now fighting for support at 16750 support zone, and old high from the previous rally. Looking very closely for the next P&F chart signal at these levels!

After a strong rally, BTC make a key P&F chart reversal, dropped 2100 after the P&F chart sell signal, and is now fighting for support at 16750 support zone, and old high from the previous rally. Looking very closely for the next P&F chart signal at these levels!

Monday 18 December 2017
FTSE Futures: FFIc1 trading between a range with the top end cloud resistance!
FTSE Futures: FFIc1 trading between a range with the top end cloud resistance at 7484, and bottom cloud support zones of 7427/7418. Last week it lost the battle to find support at top end of the cloud! This zone at 7484 is a key resistance zone! The index has been trending higher since the MACD buy signal last week.


Xetra DAX futures gapped up to cloud resistance zone!
Xetra DAX futures (FDXc1)gapped up to cloud resistance zone!
Dax futures close to top end cloud chart resistance zone at 13257. Need a breakout past this level!
Reversal risks remain!
 The DAX rebounded from cloud support, and is now at a key resistance zone! Looking for either a breakout here, or a consolidation at this resistance zone!
Dax futures close to top end cloud chart resistance zone at 13257. Need a breakout past this level!
Reversal risks remain!

Bitcoin USD hit both upside P&F chart targets!
Bitcoin USD hit both upside P&F chart targets of 19350/19650 recently. Next target is 20100, but a key P&F chart reversal remains a risk.


Friday 15 December 2017
FTSE Futures: FFIc1 lost the fight for support at top end of the cloud!
FTSE Futures: FFIc1 lost the fight for support at top end of the cloud!
Top end cloud level is new resistance zone! Downside risk towards 7395, and possible the bottom end cloud level of 7365!

Top end cloud level is new resistance zone! Downside risk towards 7395, and possible the bottom end cloud level of 7365!

DAX Futures lost the fight at key resistance zones!
DAX Futures lost the fight at key cloud chart resistance zones of 13184/13257!
Now fighting for support at bottom end cloud chart support levels of 13018. with downside risk to 12897!
Watching for potential rebound at key support levels if support comes back in!

Now fighting for support at bottom end cloud chart support levels of 13018. with downside risk to 12897!
Watching for potential rebound at key support levels if support comes back in!

Thursday 14 December 2017
Bitcoin BTC: Updated point and figure chart price targets!
Bitcoin BTC: Updated point and figure chart price targets!

- Here are the updated P&F chart targets on the 60min P&F chart.
- Upside targets are: 19350/19650/20100.
- Downside targets are: 13800/12600.
- Watching closely for either a breakout towards the upside, or a breakdown of support, then we heading to the downside targets.
- Looking out for the P&F chart trade signals next to trade these targets.
- Current P&F chart trend is up.

Wednesday 13 December 2017
Bitcoin USD Price Targets Webinar on 14th
Dear Traders
I will be discussing the updated P&F chart price targets on the 14th at the:
Round the Clock Trader - Crypto Currency Special Event.
Register at this link: Crypto Currency Special Event
Hope to see you all online.
Regards
Richard
http://www.metastock.com/alphaharvest
I will be discussing the updated P&F chart price targets on the 14th at the:
Round the Clock Trader - Crypto Currency Special Event.
Register at this link: Crypto Currency Special Event
Hope to see you all online.
Regards
Richard
http://www.metastock.com/alphaharvest
Tuesday 12 December 2017
Bitcoin BTCUSD: 20100 Next point&figure chart target!
Bitcoin BTCUSD: 20100 Next point&figure chart target!

- Bitcoin grinding higher, with a cluster of upside P&F chart targets, 19350/ 19650/ and 20100!!! A Key long term target!
- Steady grind higher, but beware P&F chart reversal risks at 450 to the downside, could mean a consolidation in trend.

Bitcoin BTCUSD: Fighting hard to get past 16666!
Bitcoin BTCUSD: Fighting hard to get past old high of 16666! Need a sustained breakout past this level!

- Front cloud support is at 13250. Consolidation risks remain high at these elevated levels!
- Critical this week for a sustained rally beyond the 16666 old high resistance zone!
- MACD signal remain positive despite BTC being extended from the cloud!

Monday 11 December 2017
FTSE 100: On its way to fight resistance at top cloud levels.
FTSE 100: On its way to fight resistance at top cloud levels 7469/7520!
Bottom of cloud level is new support zone!

Bottom of cloud level is new support zone!

Xetra Dax 30 Index: On its way to fight cloud chart resistance!
Xetra Dax 30 Index: On its way to fight cloud chart resistance!
After rebounding from key cloud chart support levels at bottom end of the cloud, cloud span B, its now heading towards the top end cloud chart resistance zone of : 13285!

After rebounding from key cloud chart support levels at bottom end of the cloud, cloud span B, its now heading towards the top end cloud chart resistance zone of : 13285!

Bitcoin BTCUSD: On its way to test resistance at 16666
Bitcoin BTCUSD: On its way to test resistance at old high of 16666. Need to see a breakout past these levels! consolidation risks remain close to this old high resistance!


Bitcoin BTCUSD: Reversed higher after a key consolidation!
Bitcoin BTCUSD: Reversed higher after a key consolidation when it met the 15500 P&F chart target. Next target is 16750 in the current rally.
 BTC is up by more than 1500 since the P&F chart buy signal after the most recent consolidation!

Sunday 10 December 2017
Bitcoin BTCUSD: Mush needed consolidation taking place!
Bitcoin BTCUSD: Mush needed consolidation taking place!
Much needed consolidation taking place after a strong rally. Front end of the cloud is a key support level in this consolidation at 12613 support zone! Rebound potential at these cloud levels!

Much needed consolidation taking place after a strong rally. Front end of the cloud is a key support level in this consolidation at 12613 support zone! Rebound potential at these cloud levels!

Thursday 7 December 2017
Bitcoin USD: BANG! It hit the 15500 P&F chart target!
BTC Bitcoin USD: BANG! It hit the 15500 P&F chart target!
Big day today for Bitcoin, it just hit the 15500 point and figure chart target activated at the breakout /P&F chart buy signal back at the 7500 buy signal level! Bitcoin is up 8000 since then!
Consolidation risk remain high at these levels now that its met the target!
Trend remain up for now until we get a P&F chart reversal! Short-term consolidation risks remain very high!

Wednesday 6 December 2017
Bitcoin marching ahead to 15500 point&figure chart target!
Bitcoin marching ahead to 15500 point&figure chart target!
The next long-term point and figure chart target is 15500 on the (250X3) point and figure chart. But beware reversals of 750. Should see consolidations on its way up towards that target.
This market has now met two recent other long-term targets.
 Looking at the 60 min Ichimoku cloud chart, the front end of the cloud at 12000 zone is the new support level for now.

The next long-term point and figure chart target is 15500 on the (250X3) point and figure chart. But beware reversals of 750. Should see consolidations on its way up towards that target.
This market has now met two recent other long-term targets.


Monday 4 December 2017
S&P 500: Need to see a follow-through of upside momentum here!
S&P 500: Need to see a follow-through of upside momentum here! Front end of the cloud is a key support zone at 2613, and the old highs of 2597 is another key support zone!
Market could test these levels and then rebound, expect a slow grind higher towards the year end.
Strategy: Swing trade from support zones!

Market could test these levels and then rebound, expect a slow grind higher towards the year end.
Strategy: Swing trade from support zones!

Dow Jones 30 Index: Need a follow-through after this breakout!
Dow Jones 30 Index: Need a follow-through after this breakout!
So far so good, but now need to see a follow-through of this breakout. Front cloud level of 23814 is a key support zone to watch!
Critical week ahead for the Dow to maintain upside momentum. If not, then the index is expected to dip back towards old highs to test for support!

So far so good, but now need to see a follow-through of this breakout. Front cloud level of 23814 is a key support zone to watch!
Critical week ahead for the Dow to maintain upside momentum. If not, then the index is expected to dip back towards old highs to test for support!

Xetra Dax 30 Index fighting for support in the cloud!
Xetra Dax 30 Index fighting for support in the cloud!
Bottom of cloud, (cloud span B) is a key support level that it tested. Potential swing trade rebound from cloud support levels!
Downside risk remain towards the 12700 zone, but watching the 12798 support level very closely this week!

Bottom of cloud, (cloud span B) is a key support level that it tested. Potential swing trade rebound from cloud support levels!
Downside risk remain towards the 12700 zone, but watching the 12798 support level very closely this week!

FTSE 100: In trouble, trading below the cloud!
FTSE 100: In trouble, trading below the cloud. Bottom of cloud at 7380 is key resistance zone!
Currently fighting for support at old cloud support levels of 7295. with downside risk towards next key cloud support level: 7215! Watching closely for a short term rebound at support levels.

Currently fighting for support at old cloud support levels of 7295. with downside risk towards next key cloud support level: 7215! Watching closely for a short term rebound at support levels.

Friday 1 December 2017
GBPUSD: Rally getting closer to major resistance!
GBPUSD: Rally getting closer to major resistance at old highs of between 1.3615/1.3660 resistance zones! (360 points in this rally since macd buy signal)
Profit taking at resistance zone!

Profit taking at resistance zone!

Xetra Dax: Fighting hard for support at top end of cloud!
Xetra Dax: Fighting hard for support at top end of cloud 12900 zone! If support holds, should see a rebound here.
Downside risk towards the bottom cloud support zone of 12800!

Downside risk towards the bottom cloud support zone of 12800!

FTSE100: In trouble, lost support at key cloud level!
FTSE100: In trouble, lost support at key cloud chart support level of 7380, at the bottom end of the cloud! Next level of support is at 7295. Price action below the cloud, and that is overall negative for the market from a cloud chart perspective.


Thursday 30 November 2017
DJI: Dow Jones Index next P&F chart target : 27500!
DJI: Dow Jones Index next P&F chart target : 27500!
The Dow Jones 30 index has taken out two P&F chart targets: 22050/21600.
Next long-term target is 27500, but not without a possible key consolidation of between 750/1000 points. That's the downside risk in the current point and figure chart rally.

The Dow Jones 30 index has taken out two P&F chart targets: 22050/21600.
Next long-term target is 27500, but not without a possible key consolidation of between 750/1000 points. That's the downside risk in the current point and figure chart rally.

DAX 30 Index: on its way to top end cloud resistance!
Xetra Dax 30 index rebounded from cloud chart support at the top end of the cloud (Cloud span A), 12911 support zone. Next major resistance zone is around the front cloud level of 13285 zone!


FTSE All Share Fighting for support at bottom cloud level!
FTSE All Share Fighting for support at bottom cloud level: 4051. Rebound here if support holds.
Top end of cloud at 4095 is a key resistance zone! Remain range bound in trade for some time now.

Top end of cloud at 4095 is a key resistance zone! Remain range bound in trade for some time now.

Bitcoin hit the 10500 point and figure chart target!
Bitcoin hit the 10500 point and figure chart target!
Expect a consolidation as it needs to digest its recent gains after hitting the 10500 point and figure chart target! Watching closely here for a P&F chart reversal to signal a major correction. A new support base need to be established at these elevated levels.

Expect a consolidation as it needs to digest its recent gains after hitting the 10500 point and figure chart target! Watching closely here for a P&F chart reversal to signal a major correction. A new support base need to be established at these elevated levels.

Bitcoin: Consolidating after strong rally!
Bitcoin: Consolidating after strong rally, with front cloud support level at 9120,a key cloud chart support zone! Key rebound zone for new trades.


Tuesday 28 November 2017
Bitcoin: Steady grind higher to 10500 P&F chart target!
Bitcoin: Steady grind higher to the 10500 point and figure chart target. But beware any (250*3) box reversal of 750 to the downside will signal the end of the trend.
Looking for a consolidation of recent moves now that its getting closer to the target.

Looking for a consolidation of recent moves now that its getting closer to the target.

Friday 24 November 2017
FTSE 100: Stuck in a trading range in the cloud!
FTSE 100: Stuck in a trading range in the cloud with resistance at top end cloud levels of 7460, and after that front cloud resistance at 7520!
Support is at bottom end cloud chart level, at 7380! If support fails, the downside target is the next level of old cloud chart support zone: 7295.
Watching for a rebound at 7380 or a breakout down of support at that level! Critical week ahead!

Support is at bottom end cloud chart level, at 7380! If support fails, the downside target is the next level of old cloud chart support zone: 7295.
Watching for a rebound at 7380 or a breakout down of support at that level! Critical week ahead!

FTSE-All Share: Stuck in a trading range in the cloud!
FTSE-All Share: Stuck in a trading range in the cloud between bottom cloud support zones at 4059, and top end cloud resistance at 4095/4131 zones! Need a breakout either way!
Critical week ahead!

Critical week ahead!

Dow Jones 30 Index: fighting hard for a breakout past old highs!
Dow Jones 30 Index: fighting hard for a breakout past old highs of 23602 zone!
Critical week ahead for a breakout, and then a rally into the year.
Fail that, the top end of the front cloud level at 23320 is a key support zone in Q4 of this year!

Critical week ahead for a breakout, and then a rally into the year.
Fail that, the top end of the front cloud level at 23320 is a key support zone in Q4 of this year!

NDX index: Need to see a follow through after this recent breakout!
NDX index: Need to see a follow through after this recent breakout, with the old high of 6346 being the new support zone. Do expect this level to be tested, but now that this market has broken out again, we need to see a stronger follow through here.
Front cloud level of 6236 is a key support zone in this rally!

Front cloud level of 6236 is a key support zone in this rally!

Tuesday 21 November 2017
Bitcoin USD Hit point&figure chart target.
Bitcoin USD Hit point and figure chart target of 8000. Next target is 10500, but beware a consolidation around the 8000 as Bitcoin needs to consolidate recent gains. Box size is 250 for this point&figure chart, beware a key reversal to the downside. So far the trend remain up, and I am on the lookout for a key reversal that could see a short-term consolidation take place.
 Turning too the Ichimoku Cloud Chart:
The cloud is a key support zone in this bull rally. With key new support at old highs of 7431 zones.
Bitcoin rebounded from old lows/front cloud support zone of 5555. Note MACD buy signal remain in place. Watching closely to see if the consolidation will give additional entry opportunities towards that 10500 P&F chart target.

Monday 20 November 2017
EURUSD: Fighting hard to get past cloud chart resistance!
EURUSD: Fighting hard to get past cloud chart resistance!
Cloud span B , at the bottom of the cloud is a major resistance zone at 1.1826, and then top cloud resistance at 1.1877 zone! Need to see a breakout past cloud chart resistance, if not, then cloud chart resistance holds, and the Euro is then expected to correct further to the downside!
Critical week ahead!

Sunday 19 November 2017
NDX Nasdaq 100 Index: Weekly cloud chart review, breakout needed!
NDX Nasdaq 100 Index: Weekly cloud chart review, breakout needed beyond old high resistance level of 6346! If resistance holds there is downside risk towards the 6236 support zone at the top end of the front cloud level.
Note the MACD sell signal, consolidation risks remain high here!

Note the MACD sell signal, consolidation risks remain high here!

S&P 500: Weekly cloud chart outlook: Next key support zone to watch!
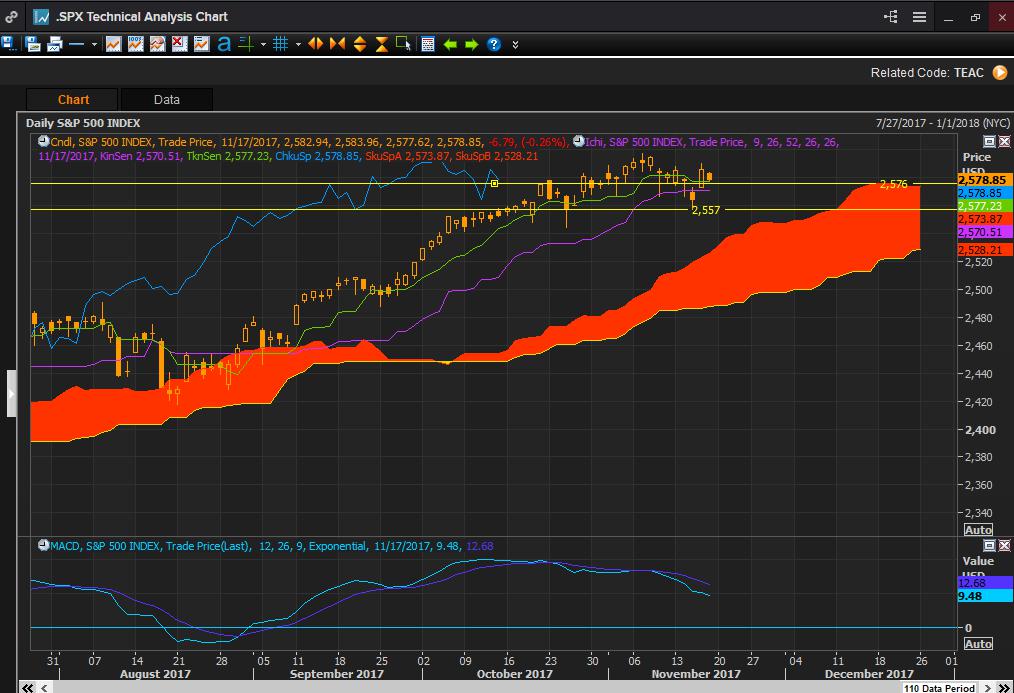
S&P 500: Weekly cloud chart outlook: Next key support zone to watch is the 2576/2557 levels.

- S&P 500 on its way to test for support at front cloud level: 2576, critical level for this coming week.
- Fail that, the next key level to be tested is at 2557 front cloud support zone.
- Note that MACD sell signal is early, but still valid. Note that we are getting closer to the next signal on the cloud chart, so not yet had a sell signal on a cloud chart basis.
- For a short term swing trade I am looking for a rebound from support zones!
FTSE100: Weekly cloud chart outlook.
FTSE100: Weekly cloud chart outlook.
Critical week ahead for the FTSE 100 index as it is fighting for support at the bottom end cloud chart support zone. (Cloud span B) Critical support zone at : 7380. Rebound potential here if support holds, if not, the further downside risk towards next old cloud chart support level of 7295.
Note that we have had both a MACD and a cloud chart sell signal a while back.

The weekly cloud indicate where the weekly cloud chart support zone is, and that there is downside risk towards this level, just below the 7200 zone.

Critical week ahead for the FTSE 100 index as it is fighting for support at the bottom end cloud chart support zone. (Cloud span B) Critical support zone at : 7380. Rebound potential here if support holds, if not, the further downside risk towards next old cloud chart support level of 7295.
Note that we have had both a MACD and a cloud chart sell signal a while back.


Xetra Dax 30 Index: cloud chart weekly outlook.
Xetra Dax 30 Index: cloud chart weekly outlook.

- Dax rebounded from old highs and cloud chart support zone levels of 12911. There is a risk that this level get re-tested this week.
- Upside resistance is at old high levels: 13094. and then the top end of the front cloud chart level at : 13280.
- Note that the MACD sell signal remains in place, with short term swing trade potential when the DAX rebound from cloud chart support zone!

Thursday 16 November 2017
USDCHF: Testing cloud chart baseline for support!
USDCHF: Testing cloud chart baseline for support at 0.9869 zone. Potential rebound area, but note MACD outlook is negative.
Potential rebound zone if support holds, with old highs are key resistance zones:1.010!

Potential rebound zone if support holds, with old highs are key resistance zones:1.010!

CADUSD: Slow grind higher towards major resistance zone!
CADUSD: Slow grind higher towards major resistance zone!
Key support is at 1.2672, at the cloud chart standard line/baseline. Old high is the next major resistance zone: 1.2928!

Key support is at 1.2672, at the cloud chart standard line/baseline. Old high is the next major resistance zone: 1.2928!

Wednesday 15 November 2017
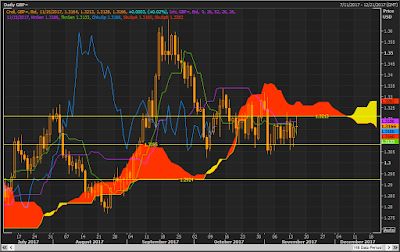
GBPUSD: Stuck below cloud chart resistance!
GBPUSD: Stuck below cloud chart resistance at 1.3213! Bottom of cloud level is a major resistance zone! Need a strong breakout past this level, fail that, expect sterling to move back down to next level of support at :1.3085!

EURUSD: Fighting hard to get past cloud chart resistance!
EURUSD: Fighting hard to get past cloud chart resistance! Bottom cloud level is a key resistance zone! Front cloud level still indicate downside risk! Need a breakout past cloud level, if not, then expect a correction if cloud resistance holds!


Subscribe to:
Posts (Atom)