Monday 31 December 2018

Xetra DAX: Testing support at old cloud chart level, but long-term trend is bearish!

Xetra DAX: Testing support at old cloud chart level, but long-term trend is bearish!


  • Dax testing support at old cloud chart support level of 10370, but the price action is below the cloud and overall long-term bearish!
  • Short-term swing trade possible back up to the bottom end cloud level or 11567/11280 resistance zones! (provided support holds at key levels)


Bottom end of the cloud on the daily chart of 11280 is a key resistance zone in the current down-trend.

  • Swing trade opportunity here if support holds, back up to cloud resistance. 
  • Downside risk towards 10370/10059 remain in place.
  • Dax is now down more than 2300 points since the initial sell signal on a cloud chart basis! A Tasty short as they say!


FTSE100: Testing support, but long-term trend remain bearish!

FTSE100: Testing support, but long-term trend remain bearish!


  • FTSE100 is showing some positive signs of support at key old cloud chart support zones of 6678/6617. 
  • Downside risk towards 6459/6315 remain in place.
  • Price action is below the cloud both on daily and weekly chart, and this confirms the bearish outlook. Short-term swing trade possible back up to the bottom of the cloud chart as well as 7137  resistance zone. 


  The FTSE100 index is now down more than  900 points since the initial sell signal! A tasty short, as they say!
Any relief rally will be used to short the index again at key resistance zones!

Thursday 27 December 2018

Nasdaq100: Rebounding from support, but not out the woods yet!

S&P500: Rebounded from support, but not out the woods yet!

S&P500: Rebounded from support, but not out the woods yet!

S&P500 index found support at old cloud chart support zone from back in June 2017! Now the upside potential is up to the bottom end cloud chart resistance zone! 
Big picture remain bearish since price action is below the cloud on both daily and weekly cloud charts!

We not out the woods yet, we need to see the price action taking place above the cloud on the 60min chart to start seeing the early signals of a new uptrend. Critical weeks ahead!

Short-term bullish up to bottom end cloud chart resistance zone!
But daily and weekly remain bearish!

Friday 21 December 2018

S&P500 Index: 2350 next downside P&F chart target!

S&P500 Index: 2350 next downside P&F chart target!

S&P500 on its way to test P&F chart trend line support at between 2400/2425. The 2350 target remains in place, and is just below the initial trend support zone.

It is a 25X3 P&F chart and this implies that if the S&P500 reverses by 75 points to the upside we can then see a trend back up as its expected to rebound from P&F trend line support zone!


German Xetra Dax Index: Downside P&F chart targets-10400/10300

German Xetra Dax Index: Downside P&F chart targets-10400/10300

The P&F chart is locked in a downtrend, with the trend lines as key resistance zones!
It is a 100X3 P&F chart and a 300 point reversal to the upside will revers the trend to the upside trend resistance lines!

Downside risks remain high!


FTSE 100: Downside P&F chart targets: 6400/6200!

FTSE 100: Downside P&F chart targets: 6400/6200!

FTSE 100 index in a downtrend based on P&F chart targets. Downside trend lines are key resistance zones!  

It is a 50X3 P&F chart so a 150 point reversal to the upside will signal the end to the downtrend on this chart, but that will only last back up to the trend resistance lines. Trend remain down for now!


Thursday 20 December 2018

S&P 500 index cloud chart analysis: Bears are running wild!

Dow Jones 30 Index: Trading below the cloud, bear market in place!

Dow Jones 30 Index trading below the bottom end support of the weekly cloud. This confirms the bear market. Downside risk towards 23236/22669.


Need to see support come in and the price to trade back above the bottom end of the cloud to be bullish! The bears are winning this one for now!


Any short-term relief rally will run into resistance at the bottom end of the cloud!

Weekly cloud chart outlook: Bearish!
Daily cloud chart outlook: Bearish!


FTSE100: Roaring bear running this index!

FTSE100: Roaring bear running this index!

Index is down more than 800 points since the sell signal! FTSE fighting to fund support at old cloud chart lows of 6678. Downside risk if support fails to 6617/6459 and 6315!

Price action below the cloud confirms bear market!


German DAX Index: Remains locked in a downtrend!

German DAX Index: Remains locked in a downtrend!

Index is now down more than 1800 points since the most recent cloud chart sell signal when it lost support at a key cloud chart level!

Key levels to watch for potential support are: 10785/10721. If support fails here, then the next downside targets are 10863/10059!

If we get a rebound at key support, then the upside targets are the bottom end of the cloud chart resistance zone!

Monday 17 December 2018

DJI- Dow Jones 30 Index Cloud Chart Market Review

Nasdaq 100 NDX cloud chart trading review.


FTSE 100: Fighting cloud chart resistance!

FTSE 100: Fighting cloud chart resistance at the top end of the cloud!

Significant resistance at 6900 zone now on the 60min chart. Key support levels to watch are 6790/6769. Front end of the cloud is encouraging but we need to see price action above the cloud to get excited about the FTSE100.


Xetra Dax 30 Index: Fighting cloud chart resistance!

Xetra Dax 30 Index: Fighting  cloud chart resistance!

The Dax is digging deeper into the cloud chart resistance on a 60min chart. Top end of the cloud remain a key resistance zone. Need to see a breakout past these levels.

Key support zones to keep an eye on are 10785/10721 for potential rebound from these support zones!

Not out the woods yet, but front end of the cloud indicate that we might see more upside as support comes in at bottom end of the cloud!

Price action on the daily is still below the cloud, and that is the bearish risk!

Monday 26 November 2018

Bitcoin BTCUSD: Hit the downside target at 3469, at top end of weekly cloud chart zone

Bitcoin BTCUSD: Hit the downside target at 3469, at top end of weekly cloud chart zone!

Downside risk to the bottom cloud support zone at 2715!

Outlook remains bearish despite short-term swing trade rebound from cloud chart support zone!


BTC is now down more than 7600 since the cloud chart sell signal!

Friday 23 November 2018

Bitcoin BTCUSD: Hit the downside target at 4317 zone!

Bitcoin BTCUSD: Hit the downside target at 4317 zone!

BTC remains in a downtrend since price action is below the cloud on the daily cloud chart basis.
BTC met the downside target of 4317 when support failed at 5414 zone! Downside risk towards 3469!!!


BTC got very close to the top end of the weekly cloud support zone of 4003. Next support zone 3469 if it fails at this 4003 zone! Short-term rebound potential from cloud chart support levels!


Thursday 22 November 2018

Brent Crude: $62.42 is the magic cloud chart number!

Brent Crude: $62.42 is the magic cloud chart number!

Brent crude is at a critical support level at the bottom end support zone on the weekly cloud chart. If support holds at this level we should see a rebound from the $62.41 support zone!


Price action still below the daily cloud chart resistance zone! There is potential for a recovery rally back up to the bottom end of the daily cloud resistance zone!

Downside risk towards 57.82 zone if support fails!

Tuesday 20 November 2018

Apple AAPL is down 20% since the cloud chart sell signal!

Apple AAPL is down 20% since the cloud chart sell signal!

Now its testing for support at 177, a key cloud chart shadow support zone! Rebound potential here if support comes back into AAPL.

The good news is on the weekly cloud chart. Can see a relief rally if AAPL finds support at bottom end cloud chart support zone of 177/175!

NDX vs NDXE: Nasdaq 100 vs Nasdaq 100 EW cloud chart analysis

NDX vs NDXE: Nasdaq 100 vs Nasdaq 100 EW cloud chart analysis:

The Nasdaq 100 index is still above the bottom end of the weekly cloud. The bull case still stands, provided the index can rebound from this key cloud chart support zone!


The Nasdaq 100 equal weighted index is trading below the cloud, and this is overall bearish from a cloud chart perspective.

Outlook has changed from bullish to bearish on this index for price action is below the cloud!
Critical week ahead to see if support will come back into the market and the index regain cloud level support!

QQQ: lost support at a critical cloud chart zone! Next level 155.51!

QQQ: lost support at a critical cloud chart zone! Next level 155.51!

The QQQ lost support at a critical top end cloud chart support zone , 162, as per the weekly cloud chart. We need to see a rebound from bottom cloud support zone! If price action takes place below the cloud that will change the outlook of the weekly cloud chart from bullish, to bearish!
Critical few days ahead for support to come back into the market!


Monday 19 November 2018

Bitcoin BTCUSD another drop in this downtrend towards new downside target: 4317!

Bitcoin BTCUSD another drop in this downtrend!

BTC remains in a bear market since price action is below  the cloud on a daily cloud chart basis.
It lost support after meeting the downside target of 5414! Support did not hold, and there is now downside risk towards the next key support zone of 4317!


On the 4 hour chart there was a sell signal above the cloud at 6427 zone! Price action is also below the cloud and this confirms the bearish outlook. 
Looking for support at next downside target : 4317!


QQQ: The good and bad news on the cloud charts!

QQQ: The good and bad news on the cloud charts!

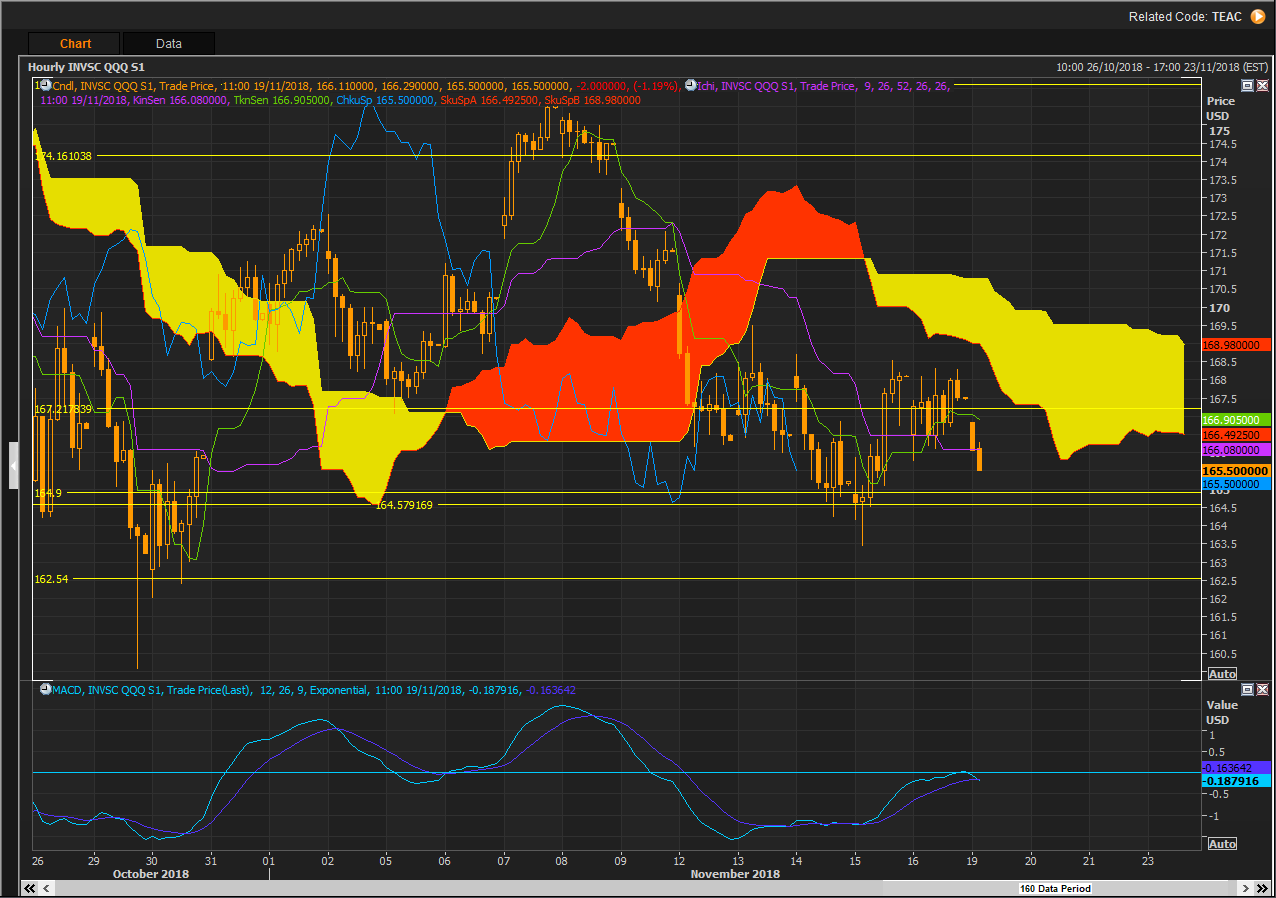
Let start with the bad news, both on the hourly and daily cloud chart, the QQQ price action is below the cloud and this is overall bearish. But there is the opportunity to trade into the year end really by buying at key cloud chart support zones.


On the QQQ daily chart the levels I am looking at for a cloud chart perspective for support and a rebound are 162.54/164.90.


Upside target will by up to the first cloud chart resistance level :173.81, then after that 177.67 with the rally end target at 184.20!


Now the good news on the weekly cloud chart, price action is still above the cloud and this bullish. Uptrend still in place, and we can see a slow grind higher into the year end rally.

Top end of the cloud here is a key rebound zone! A critical support zone where the market can rebound from in Q4.


Wednesday 14 November 2018

QQQ: Close to cloud support of 164, downside risk to 162!

QQQ: Close to cloud support of 164, downside risk to 162! There are two levels to watch for a potential rebound when support hold!


Upside potential to bottom end of the cloud at 172 resistance zone!
Rebound zone: 162/164!

Risk factor: Price action is below the cloud and that's overall bearish!


TQQQ: Testing for support at $47, rebound potential!

TQQQ: Testing for support at  $47, rebound potential!

Critical that the TQQQ rebound from this support zone! Downside risk to the $44 level!


Upside potential to the bottom end cloud chart resistance zone at $58!

Looking for support to come in at this key $47 zone!


BTCUSD: Bitcoin getting closer to old support level of 5414!

BTCUSD: Bitcoin getting closer to old support level of 5414!

BTC remains locked in a downtrend since price action is taking place below the daily cloud. Bottom end of the cloud remains a key resistance zone!
Today BTC rebounded very close to a major old support zone of 5414! Critical for BTC to remain above this level, if not, then we heading for another leg down!


Front end of the cloud still indicate that a downtrend remains in place!

Short-term swing trade back up to bottom cloud chart resistance!


Monday 12 November 2018

EURUSD: On its way to 1.1216 old cloud chart support zone!

EURUSD: On its way to 1.1216 old cloud chart support zone on weekly cloud chart.

Price action is below the cloud, and this is overall bearish for the Euro.


Friday 9 November 2018

DJI: Dow Jones index now fighting cloud chart resistance!

DJI: Dow Jones rebounded from old cloud support levels around the 2463 zone. Then the index rallied back up to the bottom end cloud chart resistance zone.

Now the index is fighting cloud chart resistance! Need to see a breakout past this cloud chart level at top end of the cloud!

We have had a great little 1500 point short-term swing trade back up to the cloud, now need to see the next move higher here for a breakout past cloud chart resistance!


Brent Crude: Downside risk to $66, old cloud chart support zone!

Brent Crude: Downside risk to $66, old cloud chart support zone!

Brent crude is fighting hard to regain support at the top end of the weekly cloud level of $72! Potential rebound zone the cloud chart level!


On the daily chart Brent lost support at top end cloud chart support zone, and now trading below the cloud. Price action below the cloud chart level is bearish. There is downside risk to old cloud support level of $66!


When support comes in between 66/71, there is a swing trade possible back up to the bottom end cloud resistance zone!


Monday 5 November 2018

GBPUSD: Fighting for support at cloud chart level!

GBPUSD: Fighting for support at cloud chart level at bottom end of the cloud: 1.2979!

After rebounding from and old low support level of 1.2703 we now fighting for support at bottom end of the cloud.

On the weekly chart there is a major support zone at 1.2815! Price action is below the cloud , and this is bearish overall. But there is the medium term trade for a rally back up to the bottom of the cloud chart resistance zone!

We back above the top end of the 4 hour cloud chart. This is good news if you long GBPUSD.
Top end of the cloud on 4H is key rebound zones in the new uptrend on a 4H chart.

Key levels to watch on GBPUSD 4 hour chart are 1.29/1.2942 cloud chart support zones! Can see support come in here, and the a move higher.


S&P500 Index: Rebounded from weekly cloud chart support level!

S&P500 Index: Rebounded from weekly cloud chart support level at 2612! Closed the week above the cloud, and that's bullish! Bottom of the cloud remain a key support zone!

Bullish trend still in place on weekly cloud chart since price action is above the cloud!

Risks remain since we have had a MACD sell signal above the cloud as well, and that remain a concern. But I am bullish on the rebound into the year end from the top of the weekly cloud chart level.

On the daily cloud chart there is upside potential up to the bottom end of the cloud chart resistance zone!

The S&P500 did manage to rebound from old support levels at 2612 zone! So far so good. Expect a rally into the year end!


Xetra Dax 30 Index: Rebounded from old support zone! But downside risks remain high!

Xetra Dax 30 Index: Rebounded from old support zone at 11280! But downside risks remain high for price action is below the cloud and that's bearish!

Short-term swing trade from support to bottom end cloud chart resistance zones!

Looking for resistance to come in at 11731/11846!

On the 60 min chart, the top and bottom levels of the cloud are key levels for the index to rebound as its grinding higher towards the bottom end cloud chart resistance zone of the daily chart!

FTSE100: Rebounded from old support zone! But risks remain!

FTSE100: Rebounded from old support zone at 6778! But risks remain for price action is below the cloud and that's bearish.
Short-term upside potential to the bottom end of the cloud chart resistance: 7259/7328 zones!

Price action is above the 60 min cloud chart level, and that's bullish short-term.
Top end of the cloud is a key support zone for price to rebound. 4
Slow grind higher to bottom end of daily chart resistance zone!


Tuesday 30 October 2018

TQQQ: Fighting hard for support at bottom end of cloud!

TQQQ: Fighting hard for support at bottom end of weekly cloud chart support zone at $47.

The TQQQ rebounded from old support low of 44.47! It is now fighting for support at bottom end of the weekly cloud! We need to see a rebound at this level! If the TQQQ trades below the cloud that will be bearish.


The daily chart is already below the cloud, and the outlook is bearish. Support levels being tested are 44 to 47!


I am looking for a rebound at the 44/47 support zone into the year end!