Wednesday 27 March 2019

TQQQ: Fighting cloud chart resistance at bottom end of weekly cloud :56.69

TQQQ: Fighting cloud chart resistance at bottom end of weekly cloud at 56.69 resistance zone! Downside consolidation risk remain high if the TQQQ can't breakout past this resistance zone!


Turning to the daily chart: The TQQQ reversed lower after hitting old cloud charf resistance at 58.58 and 56.93! Need to see a breakout past these levels, if not then we could be heading  down to the top end of the front part of the cloud at 49.88! Consolidation risk remain!


Monday 25 March 2019

FTSE100: Reversed lower after hitting weekly cloud chart resistance!

FTSE100: Reversed lower after hitting weekly cloud chart resistance!

Price action is below the weekly cloud chart resistance and this is bearish long-term!


Thursday 21 March 2019

QQQ: Running into old cloud chart resistance at 180 zone!

QQQ: Running into old cloud chart resistance at 180 zone! Consolidation risk remain here with key support at 173 zone!


Could see a consolidation back down to front end cloud support on 4H chart at 173.81!


DJI: Consolidating recent rally with front cloud level as support!

DJI: Consolidating recent rally with front cloud level as support at 25656, and cloud chart shadow support at 25533.


Critical for the DJI to remain above these support zones! The last trade yielded 2750 points. Now looking to see where the next signlas will take us.

DJI testing front cloud support zone at top end of the cloud on the 4Hour time frame.

Thursday 14 March 2019

FTSE100: At critical cloud support level! Make or break week!

FTSE100: At critical cloud support level! Make or break week! FTSE at critical cloud chart support level of 7150!
Need to see a rebound here, or if support fails then we heading back down below the cloud! Critical week!

Need to see a rebound here!

Xetra Dax: Fighting resistance at the front cloud resistance zone!

Xetra Dax: Fighting resistance at the front cloud resistance zone at 11572!
Need to see a breakout past this zone! Downside risk remain in place.


Looking at the daily DAX chart, there is a key cloud chart resistance zone at 11731! MACD signal indicate potential downside risk to top end support level of the front part of the cloud.


Two trades recently yielded 777 and 267 points!


Wednesday 13 March 2019

TQQQ: Up 48% in 45 days since buy signal, now close to key resistance zones!

TQQQ: Up 48% in 45 days since buy signal, now close to key resistance zones 52.42/54.00!

There is a MACD sell signal up at these resistance levels, profit taking opportunity to lock in the recent rally.


Downside and consolidation risk remain high at these levels! Need to see a new breakout past $54 resistance zone!


DJI: Dow Jones consolidating after a 2200 point rally since the cloud chart buy signal!

DJI: Dow Jones consolidating after a 2200 point rally since the cloud chart buy signal!

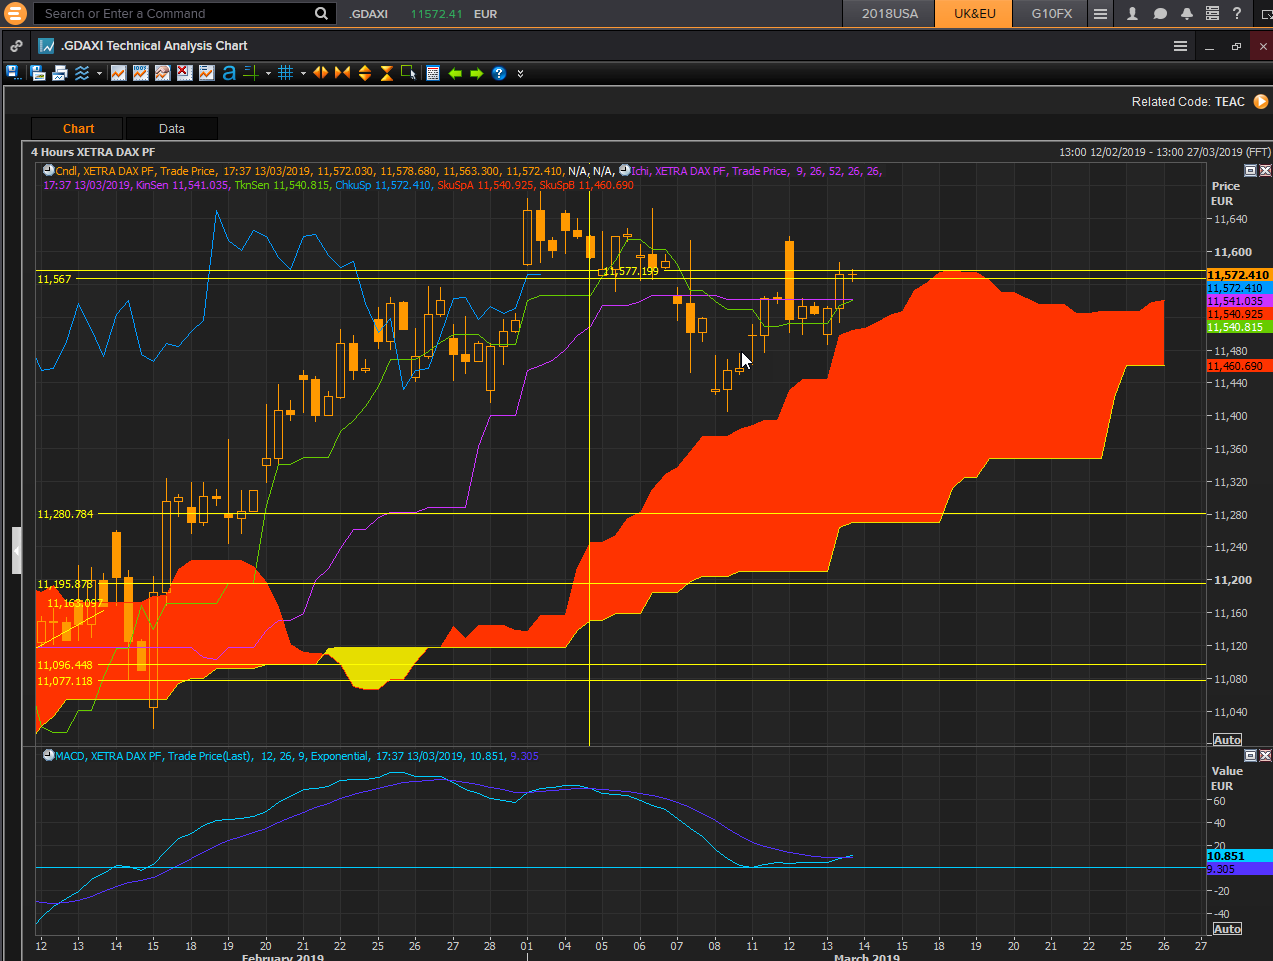
Looking at the 4 H chart we have had a fantastic 2212 point rally since the cloud chart buy signal!
The DJI is now testing support at the top end of the cloud! Downside consolidation risk remain in place if support does not hold at cloud chart level.


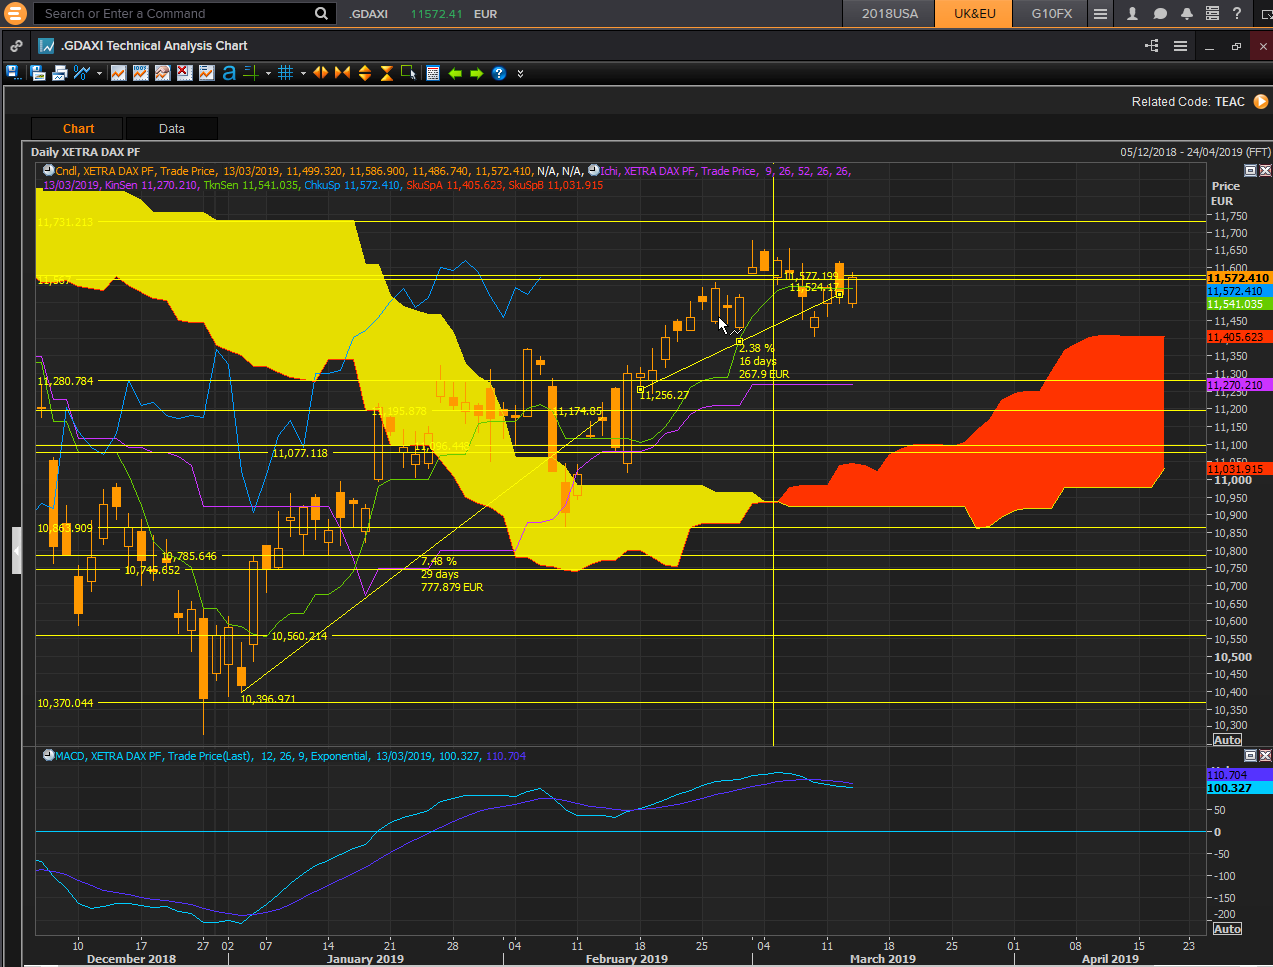
There was a sell signal on the daily chart around the 25932 cloud chart resistance level. Downside risk towards cloud  chart support levels of 25013 remain in place for now! Will see that the price action will be doing at the top end of the front cloud support level.


Monday 11 March 2019

GBPUSD: Close to key cloud chart support zone of 1.2938!

GBPUSD: Close to key cloud chart support zone of 1.2938!

Sterling is down 229 points since the sell signal above the cloud on 4H cloud chart.
Now close to key cloud chart support zone at 1.2938! Within rebound zone, with resistance at bottom end of the cloud at 1.3157 if support comes in at this 1.2938 zone!


Xetra Dax 30 index:Drifting lower towards cloud chart support zone after sell signal!

Xetra Dax 30 index:Drifting lower towards cloud chart support zone after sell signal 11577!

Next key cloud chart support zones are 11374 and then 11347, bottom end of the front cloud chart support zone!


FTSE100: Fighting for support at bottom end of the 4H cloud!

FTSE100: Fighting for support at bottom end of the 4H cloud!
Critical week ahead, if support fails, then index is heading down to next key support zone of 7024/7010!


Thursday 7 March 2019

GBPUSD: Rebounded from cloud support at 1.3118!

GBPUSD: Rebounded from cloud support at 1.3118!

Rebounded from bottom end cloud chart support zone on the 4 hour chart. Upside targets now are the top end cloud chart resistance zone at 1.3223/1.3249!


DJI: Dow Jones index pulling back after hitting old resistance levels!

DJI: Dow Jones index pulling back after hitting old resistance levels at the 26208 resistance zone!

Consilidation risk back down to the bottom end of the weekly cloud chart level :25115!


DJI daily cloud chart: Reversed lower after hitting resistance at 26208! Consolidating now down towards next support level of 25007! Note MACD sell signal recently. Looking out for a rebound at key support levels, but the index is undergoing a much needed consolidation of the recent rally.


Tuesday 5 March 2019

FTSE 100: Drifting lower after sell signal at cloud chart resistance!

FTSE 100: Drifting lower after sell signal at cloud chart resistance!

FTSE 100 index drifting lower after hitting cloud chart resistance at 7222 on the weekly  cloud chart.
Downside risk towards bottom end of the front cloud support zone at 6997!


Price action is below the cloud so outlook remain bearish for the long-term.

On the daily cloud chart the FTSE100 is now consolidating its recent rally, and drifting lower after the sell signal!
Downside risk to the next key support zone of 6997!


GDAX: Xetra DAX Index having a hard time to get past key cloud chart resistance!

GDAX: Xetra DAX Index having a hard time to get past key cloud chart resistance!

On the weekly chart we can see that the index fighting cloud chart resistance just below the front cloud resistance zone of 11741! Price action below the cloud remains bearish long-term.

Consolidation risk remain high here with the DAX trading close to the key cloud chart resistance zone of 11731! We have had a strong rally up to here since the buy signal around the 10400 level! Consolidation risk remain high here!