
Tuesday 26 September 2017
XETRA DAX 30: Cloud chart resistance remains in place!
XETRA DAX 30: Old cloud chart resistance remains remained in place, and the Dax failed to break past this resistance zone at : 12634. Now expect weakness towards top end of the cloud to test for support!

FTSE 100: On its way to test cloud support!
FTSE 100: On its way to test cloud support at top end of the weekly cloud chart support zone!


Monday 25 September 2017
S&P500: Expect the breakout level to be tested!
S&P 500: Expect the breakout resistance level of 2490 to be tested for support this week.
Consolidation risk remain!

Consolidation risk remain!

Brent Crude: Slow grind higher towards cloud resistance!
Brent Crude: Slow grind higher towards old cloud resistance at $58.50. Top end of the cloud is the new support zone at $55


Gold:Testing old cloud chart levels for support!
Gold: testing old cloud chart levels for support at 1297. If support fails here, the next key level is the top end of the cloud chart level at 1272 zone!


NDX:Nasdaq-100 On its way to test key support!
Nasdaq-100 index: On its way to test for support at the top end of the cloud chart support zone (5888)! If support comes back in at these levels, we could see a short-term rebound.


Thursday 21 September 2017
Gold: Failed to breakout past old resistance! Consolidation risk remain!
Gold: Failed to breakout past old resistance! Consolidation risk remain!
Failed to sustain a breakout past old cloud chart resistance level of 1340. Consolidation risk back down to cloud chart support at 1272 remain high.

Top end of the cloud can be a key area for a potential rebound!
Failed to sustain a breakout past old cloud chart resistance level of 1340. Consolidation risk back down to cloud chart support at 1272 remain high.

Top end of the cloud can be a key area for a potential rebound!
Copper: Consolidating towards top end cloud chart support zone!
Copper: Consolidating towards top end cloud chart support zone! After a strong rally it got very close to old cloud cart resistance zone of 3.228. Copper consolidated its gains and corrected down towards old cloud chart support level of 2.945. It is now fighting for support at this key level.

On the daily chart, there is downside risk towards the top end cloud chart support zone!
If support holds at the cloud level, we should see a rebound from cloud support.


On the daily chart, there is downside risk towards the top end cloud chart support zone!
If support holds at the cloud level, we should see a rebound from cloud support.

Brent Crude: Slow gring higher towards next key resistance zone!
Brent Crude: Slow gring higher towards next key resistance zone!
After a strong rally from the old cloud chart support low at $45, Brent crude is now in its way to test the next key resistance zone of 58.48, another old cloud chart resistance zone!
The recent cloud chart resistance level that was broken past at 55 should now act as the new support zone. This trade is up just under $10 now since the cloud chart support buy level.

Wednesday 20 September 2017
TQQQ: No excitement, just moving sideways. Need a breakout!
TQQQ: No excitement, just moving sideways. Need a breakout!
Stuck in a range since August. Need to see a breakout above old high resistance levels of 116.47!
Key support in this base is at 109.76.
Really need a breakout here, fail that, there is consolidation risk down to cloud support zone!

Stuck in a range since August. Need to see a breakout above old high resistance levels of 116.47!
Key support in this base is at 109.76.
Really need a breakout here, fail that, there is consolidation risk down to cloud support zone!

UDOW: Steady grind higher, but consolidation risk remain high!
UDOW: Steady grind higher, but consolidation risk remain high!
We had a nice little rally since rebounding from cloud chart support zone! Top end of the cloud is major support zone! Consolidation risk towards the old high/breakout zone level of: 67.66 remain high. After the breakout comes the test for support, and that's what I am looking out for.

We had a nice little rally since rebounding from cloud chart support zone! Top end of the cloud is major support zone! Consolidation risk towards the old high/breakout zone level of: 67.66 remain high. After the breakout comes the test for support, and that's what I am looking out for.

GBPUSD: Grinding higher, but consolidation risk remain!
GBPUSD: Managed to find support at cloud pivot line of 1.3195. Current key support zone level is at 1.3257. Next resistance is at 1.3915 on the weekly chart.
Outlook remain bullish on a cloud chart basis, with 1.3257 as the key support zone for this rally.
 http://www.metastock.com/alphaharvest
 Next key resistance zone on the weekly chart is 1.3915! Support at 1.3257.
Outlook remain bullish on a cloud chart basis, with 1.3257 as the key support zone for this rally.


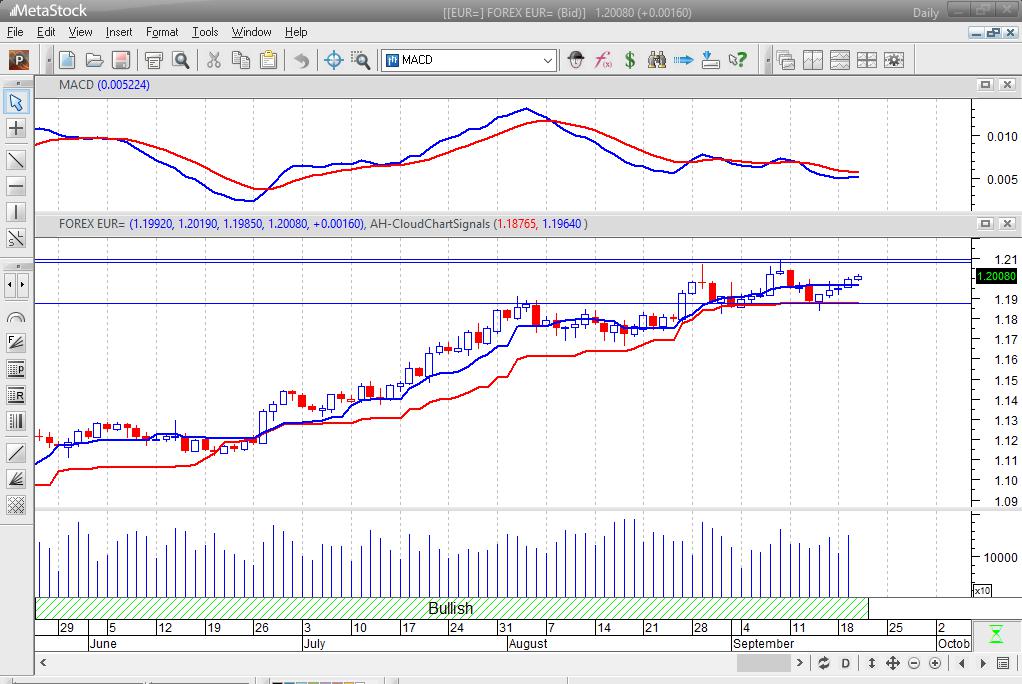
EURUSD: Rebounded from cloud pivot support!
EURUSD: Rebounded from cloud pivot support at 1.1876 zone. Next key resistance zone old highs are 1.2073 zones!
 http://www.metastock.com/alphaharvest
USDCAD: Looking for support at old low support levels!
USDCAD: Looking for support at old low support levels!
Looking for support at May June levels of 2015 of 1.2146/1.1929 key support zones! Looking for a rebound around this support zone!
 http://www.metastock.com/alphaharvest
Looking for support at May June levels of 2015 of 1.2146/1.1929 key support zones! Looking for a rebound around this support zone!

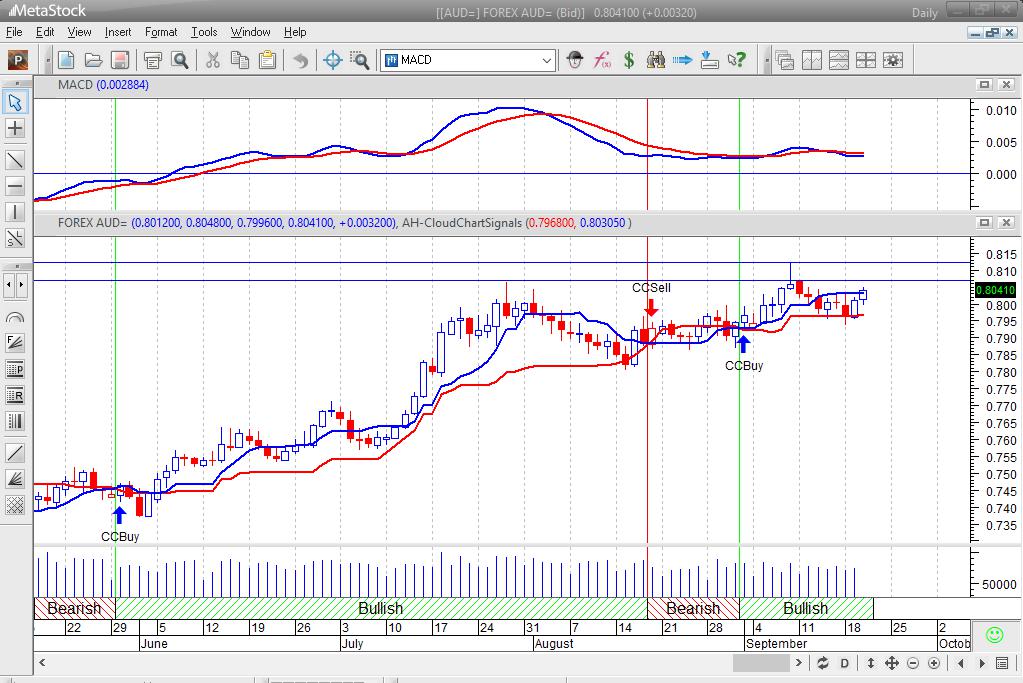
AUDUSD: Rebounded from cloud pivot support.
AUDUSD: Rebounded from cloud pivot support at 0.7996. Next resistance zones are 0.8068 to 0.8124 old high resistance zones! Slow grind higher.
 http://www.metastock.com/alphaharvest
Tuesday 19 September 2017
S&P 500: Post breakout rally, with consolidation risk!
S&P 500: Post breakout rally, with consolidation risk!
So far so good, S&P 500 managed to break past old high resistance zones: 2490! I do expect this level to be tested for support at some point soon! After the breakout comes the support test! Remain cautious around these levels, but its been a strong rally since rebounding from cloud support at 2430!

So far so good, S&P 500 managed to break past old high resistance zones: 2490! I do expect this level to be tested for support at some point soon! After the breakout comes the support test! Remain cautious around these levels, but its been a strong rally since rebounding from cloud support at 2430!

Monday 18 September 2017
BITCOIN: Rebounded from cloud chart support!
BITCOIN USD rebounded from a key cloud chart support level at 3155 zone! Blasted past bottom and top cloud chart resistance, with the next key resistance level at 4350, top end of the front part of the cloud.
Top end of the cloud is now the new key support zone!

Top end of the cloud is now the new key support zone!

FTSE100: In trouble, trading below the cloud!
FTSE 100: In trouble since price action is taking place below the cloud. The front end of the cloud indicates that we now in a downtrend. Bottom end of the cloud is a major resistance zone at 7347, and 7271 zones. The index is looking for support around the 7197 zones.
Outlook remain negative!
 Short term trading opportunity is a possible rebound back up to the bottom end of the cloud zones: 7271/7347.
Outlook remain negative!

GDAXI: German DAX index close to cloud chart resistance zone!
GDAXI: German DAX index close to cloud chart resistance zone!
The index has a good rally after finding support at key old support levels. It broke past cloud chart resistance at both the bottom and top of the cloud chart resistance levels. It is now on its way to test the next cloud chart resistance zone at 12632 zone. The level after that is 12768, but not without a consolidation around the 12632 zones. The top end of the cloud at 12443 is now the next support zone! Index is up about 550 points since the MACD buy signal.

The index has a good rally after finding support at key old support levels. It broke past cloud chart resistance at both the bottom and top of the cloud chart resistance levels. It is now on its way to test the next cloud chart resistance zone at 12632 zone. The level after that is 12768, but not without a consolidation around the 12632 zones. The top end of the cloud at 12443 is now the next support zone! Index is up about 550 points since the MACD buy signal.

Friday 15 September 2017
TQQQ: Need to see that breakout up here! Battling resistance zone!
TQQQ: Need to see a breakout past the 116.40 resistance zone! Downside risk towards the top end of the cloud remain a key risk. Key cloud support level is 108.73!
 Downside risk remain with the TQQQ trading within this consolidation base.
Key support zones are the top and bottom end cloud A and cloud B chart levels.


Key support zones are the top and bottom end cloud A and cloud B chart levels.

NZDUSD: Cloud chart outlook has changed: Bullish.
NZDUSD: Cloud chart outlook has changed: Bullish.
Note the recent cloud chart trading outlook has changed on the NZDUSD.


Note the recent cloud chart trading outlook has changed on the NZDUSD.
Support levels are at : 0.7139.
Resistance zones are at : 0.7370/0.7478!

GBPUSD: Grinding higher towards next key resistance zone!
GBPUSD: Grinding higher towards next key resistance zone! We having a steady rally in Sterling, managed to break past cloud chart pivot resistance at 1.3234. Next key resistance level is at 1.3850. Consolidation risk is now a re-test of the 1.3234 cloud zone. Note outlook and signals on chart.


GBPUSD: Broke past key cloud chart resistance level!
GBPUSD: Broke past key cloud chart resistance level at top end of the cloud: 1.3247! Expect this level to be tested for support!
The next resistance zone is at 1.3531, and then 1.3854. But its critical that Sterling remains above the top end cloud chart support zone of 1.3247!

The next resistance zone is at 1.3531, and then 1.3854. But its critical that Sterling remains above the top end cloud chart support zone of 1.3247!

EUR/USD - Rally stalling close to key old cloud chart resistance levels!
EUR/USD - Rally stalling close to key old cloud chart resistance levels! Consolidation risk remain high here!
 Looking at daily chart, its now testing front cloud support at 1.1912 zone. Downside risk towards next cloud chart support zone at top end of the cloud is at 1.1716!


BITCOIN: Close to cloud chart support at bottom end of cloud!
BITCOIN: Close to cloud chart support at bottom end of cloud! Getting closer to bottom cloud chart support zone at 3155! Looking out for a potential rebound here if support comes in at this level!
 Bitcoin has dropped by 31.2% (-$1438) since the sell signal above the top end of the cloud!

Thursday 14 September 2017
BITCOIN: Fighting hard for support at top end of cloud!
Bitcoin is down more than $900 since the sell signal. It raced downhill, towards the top end of the cloud chart support zone of 3840, support did not hold, even front end cloud support levels are being tested at 3687! If support fails to come in at these support zones, then the next key support level is at the bottom end of the cloud chart level: $3157.


Wednesday 13 September 2017
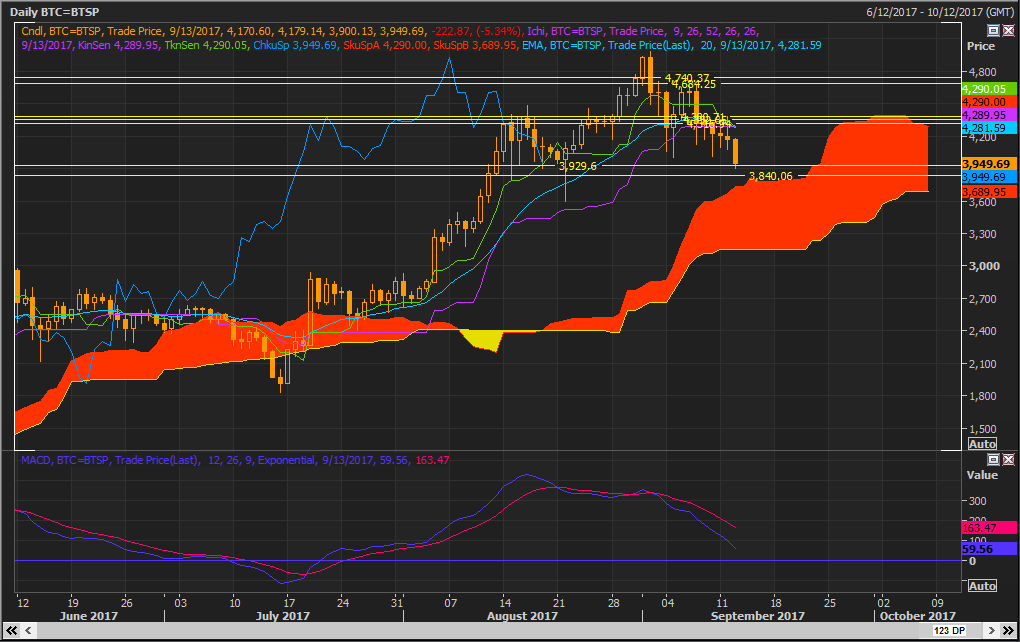
Bitcoin: On its way to test support at top end cloud chart support zones!
Bitcoin: On its way to test support at top end cloud chart support zones!
On the daily chart, the top end cloud chart support levels on its way to be tested are: 3921/3840. Potential rebound zone at support levels!
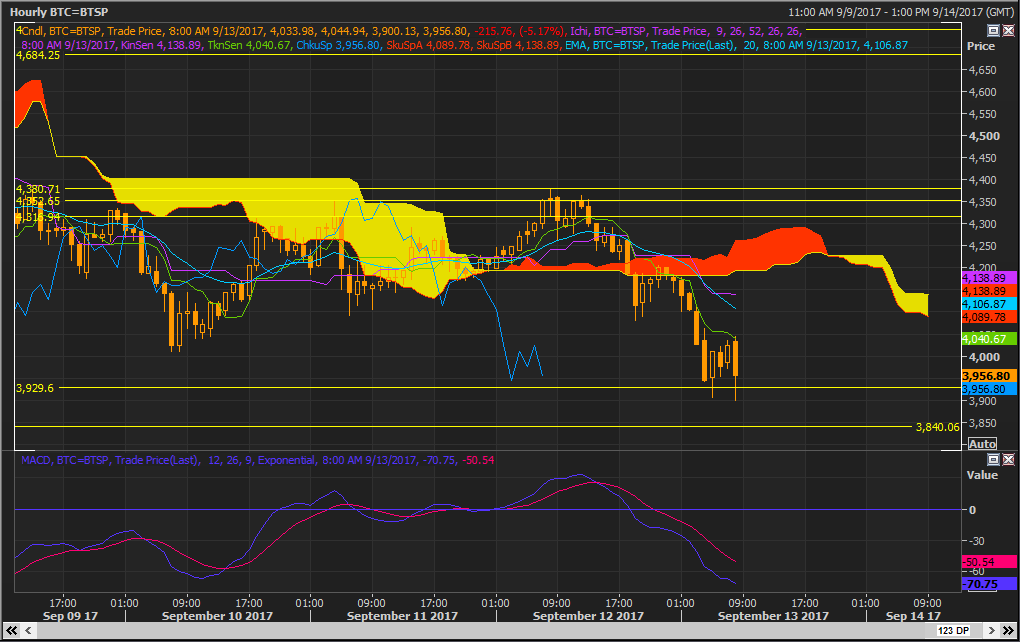
 Looking at hourly chart, support levels being tested on there are: 3929. but downside risk towards the top end cloud chart support level on the daily chart remain a key risk. Short term support rally off this low is possible, but overall the front end of cloud chart outlook remain bearish.

On the daily chart, the top end cloud chart support levels on its way to be tested are: 3921/3840. Potential rebound zone at support levels!
S&P500 Index broke past old high resistance zone
S&P500 Index broke past old high resistance zone;2490, but on average volume. Risk remain high here since the volume breakout is not significantly above average.
The S&P500 rebounded nicely after finding support at the top end cloud chart support zone. Taking some profit off the table here. Looking for a follow-through of this breakout this week, fail that, then downside risk to top end cloud chart levels remain in place.

The S&P500 rebounded nicely after finding support at the top end cloud chart support zone. Taking some profit off the table here. Looking for a follow-through of this breakout this week, fail that, then downside risk to top end cloud chart levels remain in place.

DJ30 Index: On its way to fight old high resistance levels!
Dow Jones Indices - DJ30 Industrial Avg Index - Rebounded close to the top end cloud chart support zone! Now its on its way to fight old high resistance levels around 22179.


FTSE 100 having a hard time to get past cloud chart resistance at bottom end of the cloud.
FTSE 100 having a hard time to get past cloud chart resistance at bottom end of the cloud. Top end of the cloud is the next major resistance zone at 7450 that can keep a lid on this market.
Need to see a breakout past cloud chart resistance at bottom end of the cloud!
Front end of the cloud is still showing that a downtrend is now in place! Consolidation risks remain high.

Need to see a breakout past cloud chart resistance at bottom end of the cloud!
Front end of the cloud is still showing that a downtrend is now in place! Consolidation risks remain high.

DAX30 Perf Index -At a critical resistance zone top end of the cloud
DAX30 Perf Index -At a critical resistance zone top end of the cloud: 12522. Need to see a breakout past this level. If support comes in here at the top end of the cloud, then the next key resistance zone is 12630. Critical week, need to see a breakout past cloud chart resistance here!
Cloud levels are key resistance zones!

Cloud levels are key resistance zones!

Tuesday 12 September 2017
EURUSD: Fighting major resistance zone!
EURUSD: Fighting major resistance zone!
Looking at the weekly cloud chart, we can see that the Euro is now at a major resistance zone! Old support lows are now the new resistance levels.

Consolidation risk back down to the top end cloud chart support zone is the downside risk if we do not get a breakout past the 1.2042 resistance zone!
 Top end of the cloud is the downside support zone!
Looking at the weekly cloud chart, we can see that the Euro is now at a major resistance zone! Old support lows are now the new resistance levels.

Consolidation risk back down to the top end cloud chart support zone is the downside risk if we do not get a breakout past the 1.2042 resistance zone!

GBPUSD getting close to resistance!
GBPUSD : Getting closer to old high resistance zones! Key level to watch is 1.3269 zone!
Consolidation risk remain high at these key resistance levels. (1.3269/1.3237)
Initially we had a nice rebound from cloud support at 1.2864 , but now we are close to key resistance. Taking some profit off the table around these key resistance levels.

Consolidation risk remain high at these key resistance levels. (1.3269/1.3237)
Initially we had a nice rebound from cloud support at 1.2864 , but now we are close to key resistance. Taking some profit off the table around these key resistance levels.

Monday 11 September 2017
NYMEX Futures - Crude Oil Full1017 Future: Make or break week, at critical levels!
NYMEX Futures - Crude Oil Full1017 Future : fighting for support at 47.52 zone! Key cloud chart support level. Potential rebound here. If support fails, then the next key support level is at the bottom end of the cloud at 46.48 zone!


COMEX Futures - Gold Full1217 Future:fighting old resistance levels!
COMEX Futures - Gold Full1217 Future:fighting old resistance levels from old lows to old cloud chart resistance levels. Need a breakout past this zone! Consolidation risks remain high!
But so far its been a great rally since the rebound from cloud chart support levels!

But so far its been a great rally since the rebound from cloud chart support levels!

Sunday 10 September 2017
Bitcoin: Fighting cloud chart resistance at bottom end of cloud!
Bitcoin: Fighting cloud chart resistance at bottom end of cloud! At an interesting spot here on the 60 min chart.
Bitcoin pulled back after hitting key resistance zones of 4685. Old support levels of 4380/4316 did not hold. Now its fighting cloud chart resistance at bottom end of the cloud!

Bitcoin pulled back after hitting key resistance zones of 4685. Old support levels of 4380/4316 did not hold. Now its fighting cloud chart resistance at bottom end of the cloud!

Friday 8 September 2017
TQQQ: Closer to key resistance zone!
TQQQ: Closer to key resistance zone, the old high of 116.79. Consolidation risks remain high as market progress is stalling a bit. Trading remain range bound between old highs, and key support levels of 105.20/99.75. Downside consolidation risks remain high.


TQQQ Daily chart.

SPY (S&P500 ETF) Cloud chart market review September 2017
SPY (S&P500 ETF) and S&P500 sector ETF Cloud chart market review September 2017
I review the S&P 500 SPY ETF as well as the sector ETF's from a cloud chart signal perspective. Key support and resistance levels are identified, as well as signals on the Metastock charts derived from the cloud chart algos. Happy trading, regards Richard
http://www.metastock.com/alphaharvest
Tickers covered:
SPY, XLB, XLE, XLF, XLI, XLK, XLP, XLRE, XLU, XLV, XLY.
Thursday 7 September 2017
G10FX Cloud Chart Currency Trades Review.
G10FX FX cloud chart currency trade review:
FX pairs covered in the September cloud chart FX market review:
AUD/USD
EUR/USD
GBP/USD
NZD/USD
USD/CAD
USD/CHF
USD/DKK
USD/JPY
USD/NOK
USD/SEK
Key support and resistance levels are discussed from a cloud chart trading perspective.
FX pairs covered in the September cloud chart FX market review:
AUD/USD
EUR/USD
GBP/USD
NZD/USD
USD/CAD
USD/CHF
USD/DKK
USD/JPY
USD/NOK
USD/SEK
Key support and resistance levels are discussed from a cloud chart trading perspective.
S&P 500 Index testing cloud support at critical level!
S&P 500 Index testing top end cloud levels at 2459 for support! Critical level to watch for potential rebound. If support fails here this week, next key level to watch is 2448! Critical week for support to come back into this market at cloud chart support levels.


Wednesday 6 September 2017
Bitcoin: Top end of the cloud is major support zone!
Bitcoin: Top end of the cloud is major support zone! Consolidation risks towards top end cloud chart support zone! Key support levels for current trend: 3930/3840!
 Turning to the hourly chart: The good news is that we back above the cloud, cloud chart support levels are 4380/4352/4316. Next cloud chart resistance levels are 4740/4684!
 http://www.metastock.com/alphaharvest


Tuesday 5 September 2017
G10FX: GBPUSD rebounding from support levels!
G10FX: GBPUSD rebounding from support levels! Rebounded from 21 EMA. On its way to test next key resistance zones at:1.3115/1.3247! Note MACD outlook overall.
 http://www.metastock.com/alphaharvest

G10FX: AUDUSD On its way to test old resistance zones!
G10FX: AUDUSD On its way to test old resistance zones at 0.8065/0.8164. Key resistance levels!
Slow grind higher, but consolidation risks remain.
 http://www.metastock.com/alphaharvest
Slow grind higher, but consolidation risks remain.

Subscribe to:
Posts (Atom)