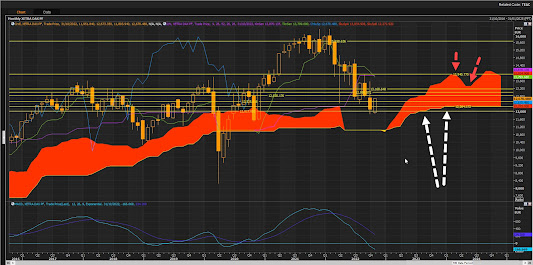
Xetra Dax Index: Hitting upside Cloud Chart resistance targets 13175! Consolidation risk back down to front cloud zone:12905! With downside risk towards 12711/12496 bottom end of the front end of the cloud! Need to clear cloud cross to trade above the cloud change outlook from bearish to bullish on the daily cloud chart.
Friday 28 October 2022
Nasdaq Composite Index: Reversed lower after hitting upside Cloud Chart resistance targets. Downside risk: 10649/10542!
Nasdaq Composite Index: Reversed lower after hitting upside Cloud Chart resistance targets. Downside risk: 10649/10542! If these cloud support levels hold could see the rebound rally resume towards the upside.
But the risk is still high since price action is still below the cloud and we need to see a breakout past cloud chart resistance for a rally to be confirmed on the 4H cloud chart.
Thursday 27 October 2022
META: Down more than 70% since the Cloud Chart signal on the weekly chart! The gift that keeps giving! Well done Zuckerberg!
META: Down more than 70% since the Cloud Chart signal on the weekly chart! The gift that keeps giving!
Well done Zuckerberg!S&P500 Index Futures Running into Cloud Chart Resistance zones of 3866 with next key resistance zone 3925! Consolidation risk remain high!
S&P500 Index Futures Running into Cloud Chart Resistance zones of 3866 with next key resistance zone 3925! Consolidation risk remain high!
If resistance holds we can expect a consolidation back down to key support zones at the front end of the cloud support levels!
Tuesday 25 October 2022
Monday 24 October 2022
Nasdaq Composite: Rebounded from the turning line of the Cloud Chart as well as the front end support zones!
Nasdaq Composite: Rebounded from the turning line of the Cloud Chart (CC) as well as the front end support zones!
The Nasdaq Composite (IXIC) rebounded from the front end cloud chart support zone on the 4H CC.
Next key resistance targets the bottom and top ends of the 4 H CC.
On the daily CC the index rebounded from the standard line support zone of the CC. Next resistance targets the bottom end of the front end of the CC.
As long as the rebound support levels hold we should see a rally into the year end.S&P500 Index Futures Rebounded from support on the 4H Cloud Chart! We have a rally!
S&P500 Index Futures Rebounded from support on the 4H Cloud Chart! We have a rally!
As long as the S&P500 futures trades above the bottom end cloud chart support zone the index can rally towards the bottom end cloud chart resistance on the daily cloud chart! Critical for support to hold on the 4H cloud chart! Price action is above the cloud and that is bullish on the 4H CC.
Upside resistance targets on the daily CC towards 3866/3926, resistance levels at the front end of the cloud chart!
Need to see price action above the cloud chart resistance to be bullish on the daily CC.
But so far on the 4H CC it looks like the market is heading into a seasonal recovery rally.
So far so good!
Thursday 20 October 2022
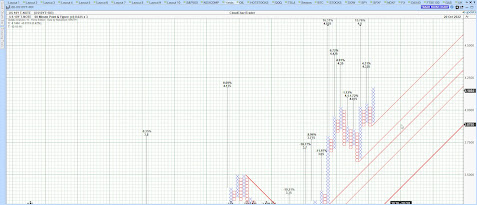
US 10Y T-Note: J Powell Power Yield Party keeps going as yields hitting the P&F chart targets! Next targets 4.9% to 5.8%! Risky times!
US 10Y T-Note: J Powell Power Yield Party keeps going as yields hitting the P&F chart targets! Next targets 4.9% to 5.8%! Risky times!
Recently yields hit the 3.975% & 4.025% P&F chart target!
On the 60 min P&F chart the upside targets are 4.175/4.325/4.35%! This comes soon after hitting the 4.075/4.1% P&F chart targets!
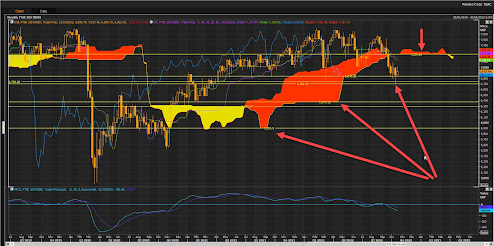
FTSE100 Rebounded from a monthly Cloud Chart support zone! Rebound potential towards the bottom end of the cloud chart zone if support holds at this level.
FTSE100 Rebounded from a monthly Cloud Chart support zone! Rebound potential towards the bottom end of the cloud chart zone if support holds at this level.
On the weekly cloud chart there is a key support zone around 6840. Price action remains bearish long-term since the FTSE100 is trading below the cloud. Short term swing trade opportunities remain towards the bottom end of the cloud towards the 7236 resistance zone! Downside bear market rally risk towards the 6373/6293 and 5901 if support fails at the 6700 zone!
On the daily cloud chart there is upside potential towards the standard line of the cloud as well as the bottom end resistance zone at the front end of the cloud 7050/7143! But there are counter trend trades since price action is below the cloud and that remains bearish long-term.
Wednesday 19 October 2022
TSLA: Rebounded from old support zone $206! Down more than 28% since the sell/short signal!
TSLA: Rebounded from old support zone $206! Down more than 28% since the sell/short signal!
On the weekly Cloud Chart TSLA rebounded from a support zone between 205/206. Swing trade potential towards the bottom end of the cloud, but do remember price action below the cloud is bearish long-term, and these trades are counter trend. So high risk!
TSLA also dropped more than 30% since the sell/short signal on the weekly cloud chart.
On the daily chart TSLA rebounded from cloud support and previous lows with the next upside resistance targets 233, the bottom end of the old cloud chart resistance, then 241 the front end cloud chart resistance, and the 259 a major upside cloud chart resistance zone!
Price action below the cloud remains bearish with opportunity in short-term swing trades back up to cloud chart resistance zones!
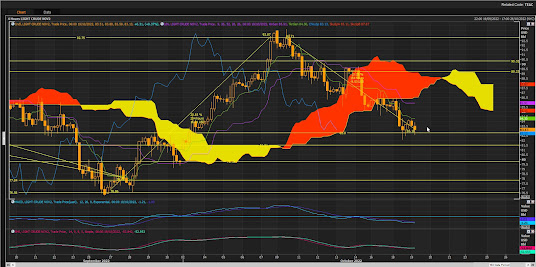
Light Crude Oil: Reversed lower after hitting cloud chart resistance at $92 zone! Downside support target zones: $78/$76
Light Crude Oil: Reversed lower after hitting cloud chart resistance at $92 zone! Downside support target zones: $78/$76.
Outlook remains bearish since price action is below the cloud with the bottom end of the cloud a key resistance zone! Swing trades from key support zones to resistance zones is the strategy when trading below the cloud!
WTI is down about 10% since the sell signal above the cloud on the 4 H cloud chart. Downside support targets expected to be tested 82.8 then the bottom of the cloud support zone of 81.51/79.78!
Tuesday 18 October 2022
Xetra Dax: Great rebound from 11946 Cloud Chart support zone! Next resistance zones 12999/13286!
Xetra Dax: Great rebound from 11946 Cloud Chart support zone! Next resistance zones 12999/13286!
If support holds the rally can last up to the bottom end cloud chart resistance zones!
On the daily CC the next key resistance levels are at the bottom end of the cloud. Need to see a breakout past this CC level to be bullish on the daily.
NASDAQ Composite: Great rebound from 10215 Cloud Chart support zone! Next resistance zone: 10920!
NASDAQ Composite: Great rebound from 10215 Cloud Chart (CC) support zone, a support zone on the quarterly CC support zone of the standard line of the CC.
Next resistance zone: 10920 is the bottom end of the front end of the daily CC with the next level of the resistance at the standard line around the 11192 zone!
Short-term high risk swing trades since price action is below the cloud and that remains overall bearish.
Friday 14 October 2022
S&P500 Index: Great rebound from old cloud chart support zones 3548! Upside potential 3865/3969!
S&P500 Index: Great rebound from old cloud chart support zones 3548! Upside potential towards the next key resistance zones at 3865/3969. If support holds at these key cloud chart levels can see a rally back up to the bottom end of the cloud!
Thursday 13 October 2022
US 10Y T-Note: BINGO! Winning number is: 4.025%. Yield party keeps going as yields hitting the P&F chart targets! Next targets 4.9% to 5.8%! Risky times!
US 10Y T-Note: BINGO! Winning number is: 4.025%. Yield party keeps going as yields hitting the P&F chart targets! Next targets 4.9% to 5.8%! This comes soon after yields hit the 3.6%/3.75% & 3.975% P&F chart targets!
Risky times as the yield party keeps going and going! A P&F chart reversal will signal the end of the current trend!
Wednesday 12 October 2022
TSLA: Heading towards next key cloud chart support zones:207/206! TSLA down more than 24% since the sell signal!
TSLA: Heading towards next key cloud chart support zones : 207/206 with downside risk towards 198! Looking for a potential rebound from these key old cloud chart support zones!
TSLA down more than 24% since the sell signal on the 4 hour cloud cloud chart!
S&P500 Futures: Downside risk: 3471. A Major monthly cloud chart support zone!
S&P500 Futures: Downside risk: 3471. A Major monthly cloud chart support zone! Index down more than 24% since the initial sell signal above the cloud!
On the weekly cloud chart the index is close to an old cloud chart support zone of 3548! Potential swing trade rebound zone! Downside risk on the weekly towards 3471/3245!
If support holds at the 3548 zone rebound potential upside resistance levels are 3865/4008!
Xetra Dax Index: Downside risk 11184/11025 after losing support at 12275 on the monthly cloud chart!
Xetra Dax Index: Downside risk 11184/11025 a key cloud chart support zone. Xetra Dax lost support at the 12275 front cloud support zone on the monthly cloud chart!
On the weekly the Dax is fighting hard to find support for a potential rebound at the 12151 cloud chart support zone. Downside risk towards 11184/11025 the bottom end of old cloud chart support zones!
12815 new upside resistance zone as well as 12905/13286 and these levels can be tested if we get a rebound relief rally.
Tuesday 11 October 2022
Nasdaq Composite Fighting hard for support at 10408 cloud chart support zone! Downside risk to 9346 on the cloud chart!
Nasdaq Composite fighting hard for support at 10408 cloud chart support zone! Downside risk to 9346 on the cloud chart if support fails at key cloud chart levels! Short-term rebound swing trades possible from key cloud chart support zones!
Price action is below the cloud and this is bearish long-term!
Thursday 6 October 2022
CLc1: Light Crude up more than 15% since the cloud chart support zone rebound at $77/$76. Next resistance zones of $89/$90 & $92!
CLc1: Light Crude up more than 15% since the cloud chart support zone rebound at $77/$76.
On its was to the bottom end cloud chart resistance zones of $89/$90 & $92 zones!
Wednesday 5 October 2022
Xetra Dax Rebounded from a major cloud chart support zone 12017! Upside resistance targets 12713/12905/13168 for the Q4 rally!
Xetra Dax Rebounded from a major cloud chart support zone 12017! Upside resistance targets 12713/12905/13168 for the Q4 rally!
Xetra Dax managed to find support at the front end of the monthly cloud chart level of 12264/12017! Upside resistance zones 13318/13940!
On the daily cloud chart key resistance zones are turning line of the cloud at 12713 then towards the top end of the front end of the cloud at 12905/13168. A relief rally in an over bearish cloud chart!
FTSE100: Rebounded from 6833 cloud chart support zone! Upside resistance targets: 7156/7237!
FTSE100: Rebounded from 6833 cloud chart support zone! Upside resistance targets: 7156/7237 the bottom end of the weekly cloud chart! FTSE needs to break past the cloud chart resistance to be back in bullish outlook. Price action below the cloud remains bearish. Swing trade rebound from the 6861/6833 old cloud chart support zone worked out well.
On the daily cloud chart the next key resistance zones are the front end of the cloud at 7086, the bottom end of old cloud chart support at 7164/7240 with the upside resistance target at 7291 as the Q4 seasonal rally is starting to take off now.
Tuesday 4 October 2022
Monday 3 October 2022
AAPL: On its way to test support zones of 138/129. Down more than 18% since the sell signal!
AAPL: On its way to test support zones of 138/129. Down more than 18% since the sell signal!
Apples are going off since AAPL sliced past the bottom end cloud chart support zone and then entered a bearish outlook. Price action below the cloud is bearish.
On its way to test old cloud chart support levels at the bottom end of the cloud at 138 and with more downside risk to the June low of 129! Swing trade rebound potential from key support levels back up to the bottom of the cloud if support holds at these support zones!


