Friday 31 May 2019

WTI On its way down to next cloud chart support zone: $54!

WTI On its way down to next cloud chart support zone: $54!
WTI reversed lower after hitting cloud chart resistance at bottom end of the weekly cloud: $65.84.
Now in its way to test support at bottom end of the front cloud chart section at a key support zone of : $54.08!


WTI is down $9.90 since the sell signal at cloud resistance!


Wednesday 29 May 2019

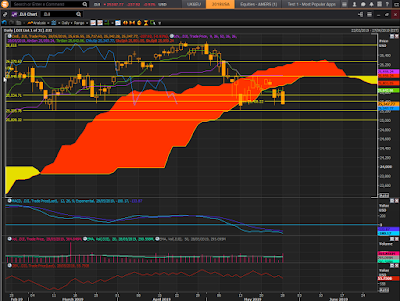
DJI: Dow Jones index in trouble as price action is below the cloud! Bearish!

DJI: Dow Jones index in trouble as price action is below the cloud! Bearish!

DJI did not manage to remain above the bottom end cloud chart support zone! Now trading below the cloud with significant downside risk.
Two key support levels to watch out for are 25205/25009!

Need to see a rebound back above the bottom end cloud support level to change outlook from bearish to bullish! Criticla week ahead!


NDX100: At a criticla cloud chart support zone! Make or break week ahead!

NDX100: At a criticla cloud chart support zone of 7275! Make or break week! Need to see a rebound form this support zone, if support fails, then there is more downside risk if the NDX100 closes below the bottom end cloud chart support zone!


FTSE100: In trouble, sliced past cloud support zone! Trading below cloud! Bearish!

FTSE100: In trouble, sliced past cloud support zone! Trading below cloud! Bearish!

FTSE100 sold off after hitting cloud chart resistance at top end cloud level: 7339.

Bottom end of the cloud is now the new resistance zone!
Price action below cloud, and this is bearish!


Tuesday 28 May 2019

Xetra Dax: Digging into cloud chart resistance:12141!

Xetra Dax: Digging into cloud chart resistance:Next target 12141!

Top end of the cloud is the next key resistance zone! Price action is still below the top end of the cloud and this is bearish. Need to see a breakout past top cloud chart resistance!


FTSE100: Rebounding from old support zone, top end cloud next target!

FTSE100: Rebounding from old support zone, top end cloud next target!

FTSE100 digging into the cloud on the 4 hour chart. Top end of the cloud is the next key resistance zone at 7340!

Price action is still below the top end of the cloud, and that remains bearish!

Friday 24 May 2019

Nasdaq 100 NDX: Rebound potential as index is testing support at bottom end cloud support zone!

Nasdaq 100 NDX: Rebound potential as index is testing support at bottom end cloud support zone!

Index rebounded yesterday from the bottom cloud support zone: 7275!
Looking for a follow-through today for a rebound from this cloud support zaone!  If the NDX trades below the cloud level, that will be very bearish for the index. We right here at an infliction point!


FTSE100: Make or break day at bottom end cloud chart support zone!

FTSE100: Make or break day at bottom end cloud chart support zone!

Need to see a rebound here, if not, then more downside risk if support does not hold at this level!


Thursday 23 May 2019

TSLA Tesla down 43% since cloud chart sell signal! Now testing old support zones!

TSLA Tesla down 43% since cloud chart sell signal! Now testing old support zones! Price action is below the cloud and that is bearish long-term. Short-term technical retracement the upside potential, but outlook remains bearish below cloud!

Weekly cloud chart key support levels being tested at 191/181!

Will be interesting to see if we will get a technical rebound at these support levels!


GBPUSD: Testing old cloud chart support zone: 1.2624!

GBPUSD: Testing old cloud chart support zone: 1.2624!

Make or break day here as Sterling is testing old cloud chart support lows of February. 1.2624 to 1.2602 key support zones! downside risk remain high if support fails at these levels.

Price action is below the cloud, and it remains bearish. GBP is down more than 550 points since the cloud chart sell signal!

Wednesday 22 May 2019

Light Crude CLc1 Fighting hard to get past key cloud chart resistance at $63.14!

Light Crude CLc1 Fighting hard to get past key cloud chart resistance at $63.14!

WTI reversed lower after hitting cloud chart resistance at 64.58 zone!

Need to see a breakout past cloud chart resistance of 63.14, but donwside consolidation risk remain high here with possible support at front of the cloud at 59.65! (if we dont get that breakout past cloud resistance!)


Tuesday 21 May 2019

GBPUSD: The Gift that keeps on giving! GBP Short!

GBPUSD: The Gift that keeps on giving! GBP Short!


Xetra DAX Index: Having a hard time to break past cloud chart resistance: 12329!

Xetra DAX Index: Having a hard time to break past cloud chart resistance at top end of the cloud! 12329 is a major resistance zone!

Downside consolidation risk remain high here if the DAX fails to break past cloud chart resistance! Watching for that sell signal!


QQQ ETF: Critical week ahead! Next key support zone: 178/176!

QQQ ETF: Critical week ahead! Next key support zone: 178/176!

Critical week ahead as I am looking for a rebound at the next key support zone of 178/176!

The QQQ is highting hard for support at the top end of the cloud! Downside risk towards bottom cloud chart levels! If support holds at this cloud chart level, we can see a rebound from these key support zones!

Thursday 16 May 2019

FTSE100: Fighting hard for support at top end of the cloud after a 320 point drop since sell signal!

FTSE100: Fighting hard for support at top end of the cloud after a 320 point drop since sell signal!

FTSE managed to rebound from old support levels, and is now fighting resistance at top end of the cloud!

The index dropped as much as 320 points before the rebound from a key support zone!
If resistance holds here at the top end of the cloud that would be another sell signal!

Xetra Dax consolidating after strong Q1 rally! Downside risk: 11739!

Xetra Dax index is consolidating after a strong rally in Q1. There was a profit taking sell signal recently, and the index is now looking for support at key levels!

From a cloud chart perspective the index ran into resistance at the top end of the cloud chart resistance zone 12328 on the weekly cloud chart!
Downside risk towards front cloud support zone of 11739/11125!


Wednesday 15 May 2019

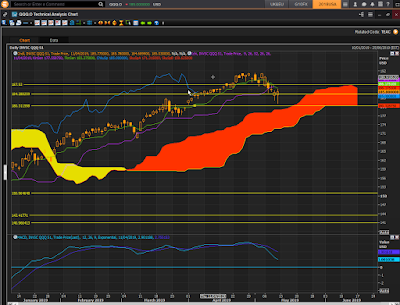
QQQ Fighting hard for support at top end of the cloud!

QQQ Fighting hard for support at top end of the cloud at 180 level. There is downside risk towards the bottom cloud support zone of 176!


Need to see a strong rebound from this cloud testing that is taking place.
Note the MACD sell signal around the 190 zone!


Bitcoin BTC up 110% since cloud chart cross buy signal!

Bitcoin BTC up 110% since cloud chart cross buy signal!

So far so good, we had a little rally in BTC. But now its fighting a key resistance zone at the 8200 resistance zone! Consolidation risk remain high here!


On the weekly chart we can see that BTC is digging into the major cloud chart resistance at the bottom end of the cloud! Taking some profit off the table here at this cloud chart resistance zone!


Monday 13 May 2019

QQQ Nasdaq QQQ ETF: Pulling back to front cloud support zone:180!

 QQQ Nasdaq QQQ ETF: Pulling back to front cloud support zone:180!

After a breakout and strong rally the QQQ is consolidating its recent gains with  a pullback to front cloud support of 180!


DJI Dow 30 index fighting for support at top end of the cloud!

DJI Dow 30 index fighting for support at top end of the cloud!

After hitting cloud chart resistance at old cloud chart resistance levels of 26616, the Dow is now consolidating recent moves. DJI is looking for support at top end of the cloud with downside risk to the bottom end cloud chart support zone of 25408 and 25000! Dow is down more than 600 point since the sell signal.


Wednesday 1 May 2019

Bitcoin : BTC: Consolidating recent rally, with bottom of weekly cloud as resistance target!

Bitcoin : BTC: Consolidating recent rally, with bottom of weekly cloud as resistance target!


Trade signals are as per MACD on the chart!