Tuesday 31 January 2023

TSLA: 60%+ Rebound rally reached the Cloud Chart Resistance $179 Target Zone. Consolidation Risk: 152/141 and 131!

 TSLA:  60%+ Rebound rally reached the Cloud Chart  (CC) Resistance $179  Target Zone. Consolidation Risk:  152/141 and 131! 

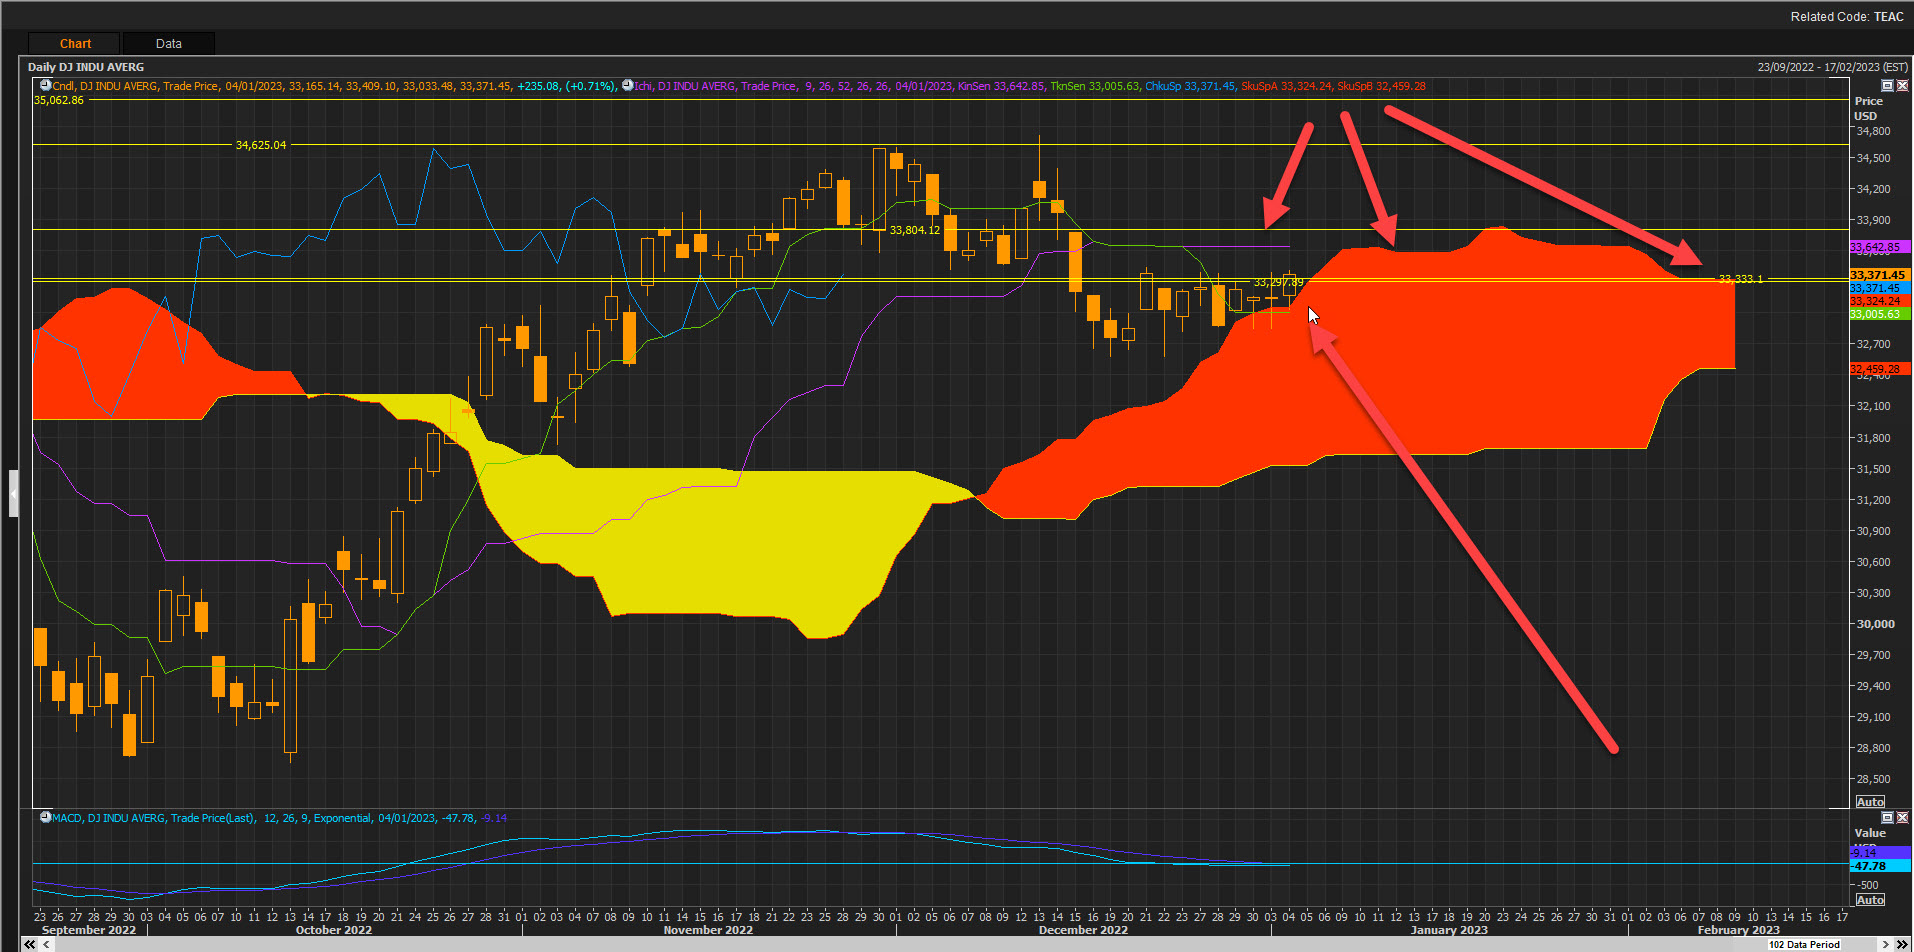
Need to see a breakout past the top end CC resistance zone (179) to change the outlook from bearish to bullish on the CC. There is downside consolidation risk towards the bottom end and front end CC support zones 152/131! Swing trade opportunity when TSLA tests the STD line of the cloud as well as the TL of the cloud. As long as TSLA can remain above the bottom end of the CC support zone there might be a new bull rally emerging on the daily CC. 


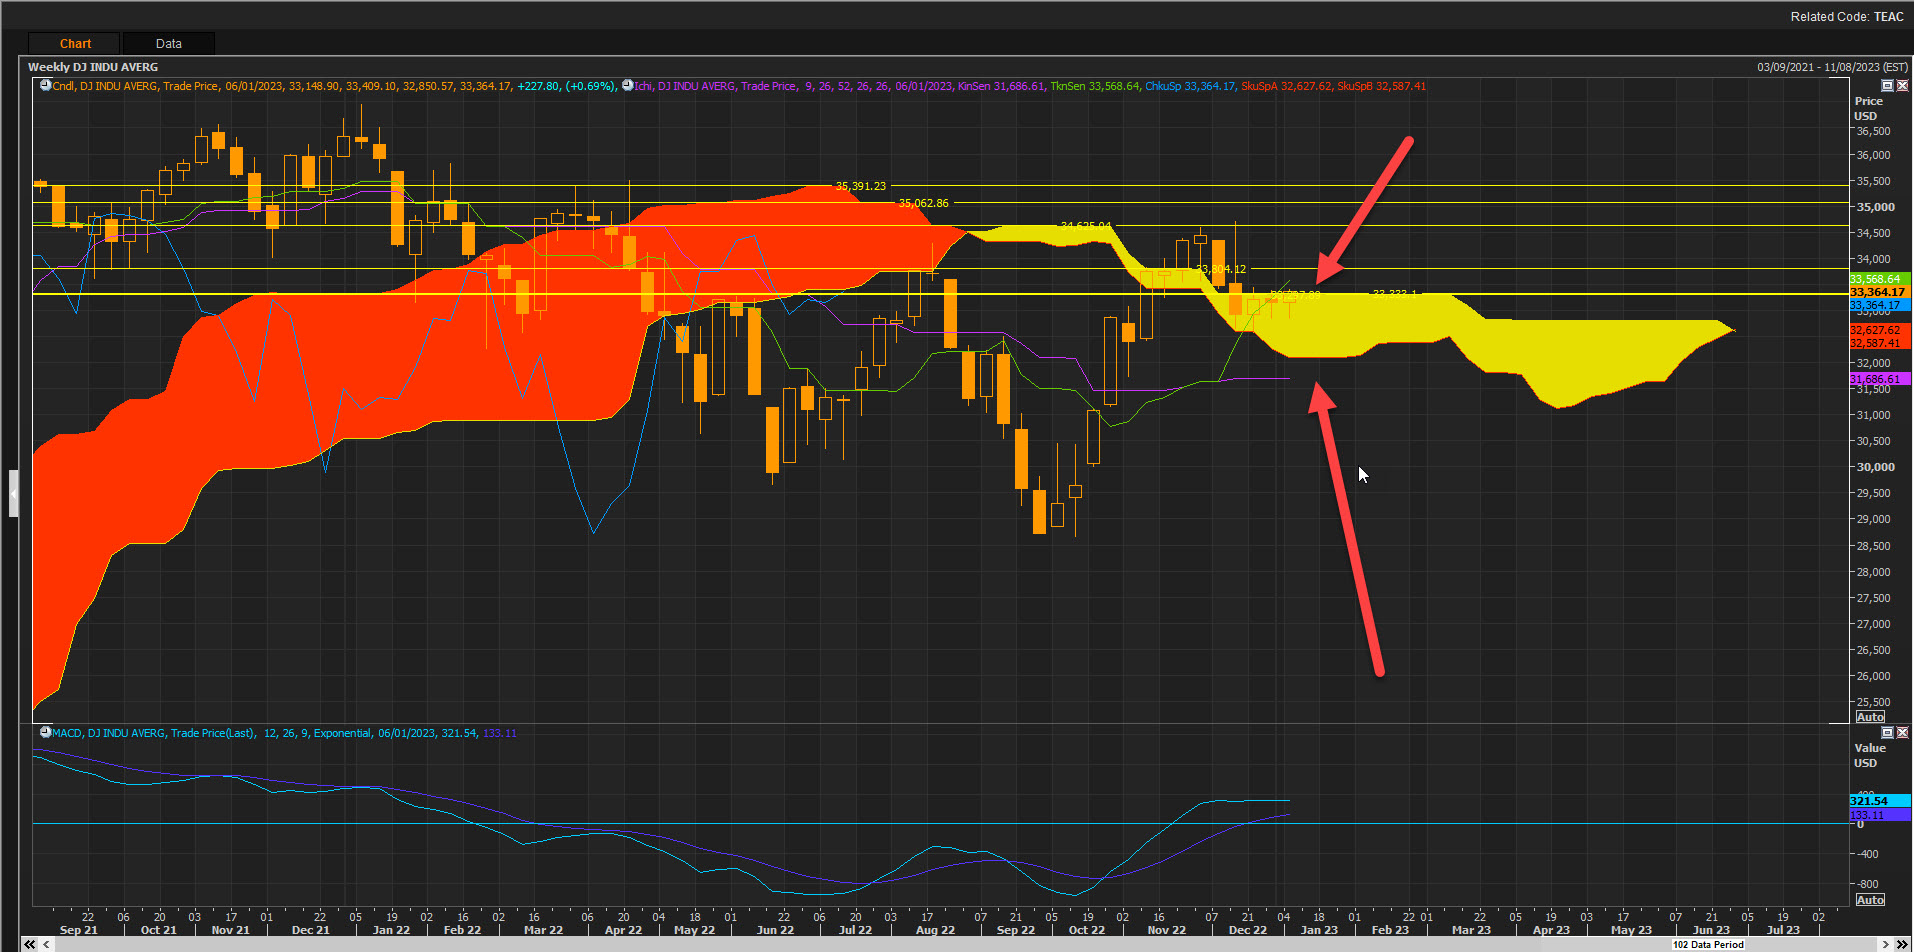
The weekly CC show the 179 front end Cloud Chart resistance zone.  Can see a rebound if support comes in at the TL of the CC at 146! Upside resistance targets are 179 then 208 (STD line of the CC) and then the top end of the CC at 243! Downside risk on the weekly is around the 128 zone another support zone on the daily CC. Looking for rebound swing trades from key CC support zones towards the key CC resistance zones!


Monday 30 January 2023

Nasdaq Composite Index: Rebound rally running into old Cloud Chart resistance zone! Need to see a breakout past the 11683/11814 resistance zones!

 Nasdaq Composite Index: Rebound rally running into old Cloud Chart (CC)  resistance zone! Need to see a breakout past the 11683/11814 resistance zones! 

IXIC index rebounded more than 10% since finding support at the old CC support zone of 10262! The index pulled back after hitting the Standard line of the CC as well as getting closer to an old support zone that is now a new resistance zone on the CC  of between 11683/11814! Need to see a breakout past these levels towards the bottom end CC resistance zone! Reversal risk remain high at these key resistance zones!


The daily IXIC Cloud Chart (CC)  is in better shape since price action is above the cloud and that is bullish. Consolidation risk down towards the top end of the front end of the cloud remain a key risk factor in this rally. Key support levels to keep an eye on : 11177/10802! Trading strategy is to swing trade support rebounds towards key Cloud Chart resistance zones! 


Thursday 26 January 2023

TSLA Cloud Chart Support Rebound rally up +31% after hitting support around the $109.95 zone! Next resistance zones to test: 150/161 and 179!

 TSLA Cloud Chart Support Rebound rally up +31% after hitting support around the $109 zone! Next resistance zones to test: 150/161 and 179 if support holds.  So far so good. 


Key risk factor to keep an eye on is that TSLA must remain above the monthly Cloud Chart support zone to be bullish on the monthly chart. $91 remains a downside risk target if support fails!


So far both daily and weekly Cloud Charts are still bearish since price action is below the Cloud and the Cloud acts as resistance on the D & W charts. Swing trade strategies are the rebound trades from Cloud support zones  back up to the bottom end of the D & W Cloud charts resistance zones!


For any long-term positions TSLA needs to trade back above the top end of the Cloud to be bullish! Trading strategy : Just the swing trades from support to resistance at the bottom end of the Cloud Chart. Quick and cheerful trades!


Tuesday 24 January 2023

Nasdaq 100 Futures: Rebound rally going well after the AI generated volatility trades on the 4H chart! +1344 total points.

 Nasdaq 100 Futures: Rebound rally going well after the AI generated volatility trades on the 4H chart! +1344 total points (834+510). Winning with AI! 


Monday 23 January 2023

Xetra Dax Index Futures: Two great AI generated Swing Trades on the 4H Charts = +1200 points!

 Xetra Dax Index Futures: Two great AI generated Swing Trades on the 4H Charts = +1200 points! 

Winning with AI! 


S&P500 EMINI Futures Trade: Two great AI generated trades on the S&P500 index!

 S&P500 EMINI Futures Trade: Two great AI generated trades on the S&P500 index! 

Two great AI (artificial intelligence) generated trades, swing trade and a volatility breakout trade on the 4H chart! Wining with AI!


Dow Jones DJI Index: Rebound rally from 33006 CC support zone now closer to top end CC resistance zone 33804!

 Dow Jones DJI Index: Rebound rally from 33006 CC (Cloud Chart)  support zone now closer to top end CC resistance zone 33804! Need a breakout past top end  of the cloud  resistance zone!  If the DJI manages to break past this top end CC zone, then the next key resistance zone is around 34297/34625 targets!


On the 4 H CC the rebound rally started after the DJI managed to find support at 33006 old CC support zone/Turning Line support zone of the CC. Good news is that on the 4H CC the DJI is back above the 33640 level, a critical resistance zone that can now be a key support zone if support holds. The upside targets on the 4H CC are  33804/34011/34297! 


Tuesday 10 January 2023

S&P500 Index: Fighting hard to rebound from front Cloud Chart support zones: 3834/3889!

 S&P500 Index: Fighting hard to rebound from front Cloud Chart support zones: 3834/3889! 

S&P500 managed to rebound from the front Cloud Chart (CC) support zone of 3834, as well as old cloud chart support zone of 3889!  There is a major resistance zone at the bottom end of the cloud that the index need to break past! Price action below the cloud remains bearish! A key trend line resistance zone is also a major obstacle at 4021!  A breakout past that zone can lead to a rally to the top end of the cloud at 4153! 

Downside risk 3602 another old CC support zone! Critical month ahead for a rally past CC resistance!


Overall price action is bearish with swing trade opportunities to both the bottom of the cloud and the old cloud chart support zones!


COIN.O Coinbase Battling to survive the crypto bear market as COIN is now down more than 88% since the Cloud Chart Sell signal! Time for new management!

 COIN.O Coinbase Battling to survive the crypto bear market as COIN is now down more than 88% since the Cloud Chart (CC) Sell signal! 

Down more than 88% since the primary CC sell signal, and down more than 86% since the CC secondary sell signal! Time for new management! What a beautiful short trade it was! 


What a beautiful short trade it was! 

Thursday 5 January 2023

US 10Y T-Note: J Powell Power Yield Party keeps going as yields hitting the P&F chart targets! Next targets 4.2% to 4.45%! Risky times!

 US 10Y T-Note: J Powell Power Yield Party keeps going as yields hitting the P&F chart targets! Next targets 4.2% to 4.45%! Risky times!

US 10Y T-Note consolidated after hitting the 4.375% target. The reversal met the downside P&F chart target of 3.575% Rebounded from P&F chart trend line support at 3.5% and then met the 3.8% target! Next two targets are 4.2% to 4.45% Currently testing trend line support at the 3.69% zone! Critical month ahead! 


TSLA: "In Musk We Trust" Trade getting closer to the next Cloud Chart Target of $91! Downside risk to $66! TSLA down more than +65% since the CC sell/short signal!

 TSLA: "In Musk We Trust" Trade getting closer to the next Cloud Chart Target of $91! Downside risk to $66! TSLA down more than +65% since the CC sell/short signal!

Swing trade potential from these key support zones as TSLA share price expected to technically retrace some of of recent losses. $159 is now the new major upside resistance zone! The current correction met the 204/195, 161/159 and the 129 downside Cloud Chart targets!


Wednesday 4 January 2023

Dow Jones Industrial Index: Fighting hard to break out past key Cloud Chart resistance zone!

 Dow Jones Industrial Index: Fighting hard to break out past key Cloud Chart (CC) resistance zone! 

The weekly CC looks rather risky from a CC resistance point of view! 


Critical week ahead for a strong high volume breakout past these resistance levels! 

On the daily CC the DJI is fighting to maintain support at the top end of the CC. The 33333 front cloud resistance zone seems to be a critical resistance zone to get past! Price action above the cloud is bullish and offer swing trade opportunities if support holds at the top end CC zone!


Downside risk to the bottom end of the cloud for Q1! 


S&P500 Index Futures Fighting hard to rebound from bottom end Cloud Chart support zones!: 3809/3855! Upside resistance at 3920/3926 to 3993!

 S&P500 Index Futures Fighting hard to rebound from bottom end Cloud Chart support zones!: 3809/3855! Upside resistance at 3920/3926 to 3993!

As long as the S&P500 trades above the bottom end of the cloud the CC is bullish for now but with added risk since price action is not totally clear of the cloud.  If the S&P moves below the bottom end CC level of 3809/3839 and trades below the CC then the outlook will be bearish. 


So far the S&P500 index is fighting hard to remain above the key CC support zones!