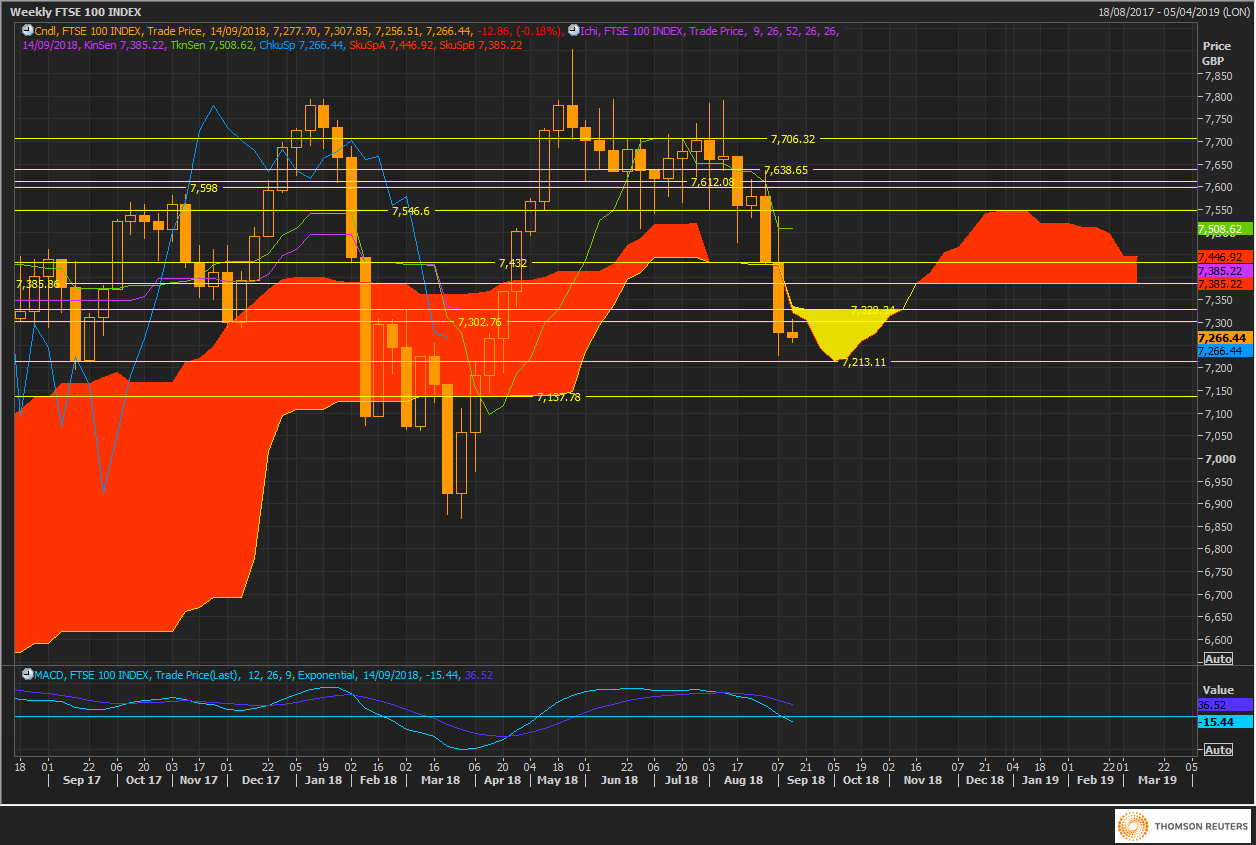
FTSE100: Still fighting for support at key levels!
Old cloud support levels that can come in as a key support zone for the FTSE100: 7302 to next cloud support zone: 7213!
Resistance now remain bottom end of the cloud resistance zones of 7546/7638
Looking for a rebound trade at key support zones!
Weekly cloud chart support levels are 7213/7137 with resistance at 7386!
Looking for a rebound at key cloud chart support zones!
Trend remain down for now since price action is taking place below the cloud chart level!