Monday 18 December 2023
Thursday 14 December 2023
Wednesday 13 December 2023
QQQ ETF Up 47% since the Artificial Intelligence buy signal! QQQ moving into major resistance zone: 399/408! Winning with AI!
QQQ ETF Up 47% since the Artificial Intelligence buy signal! QQQ moving into major resistance zone: 399/408! Consolidation risk remain high here! Winning with AI!

NDX100: AI bubble rally getting closer to the next upside resistance target zone of 16395/16760! NDX up 35% since the CCT buy signal!
NDX100: AI bubble rally getting closer to the next upside resistance target zone of 16395/16760! NDX up 35% since the Cloud Chart Trading buy signal! So far so good! Winning with algorithms!

Tuesday 12 December 2023
Thursday 7 December 2023
Tuesday 5 December 2023
Thursday 30 November 2023
Tuesday 21 November 2023
Thursday 16 November 2023
Tuesday 14 November 2023
Tuesday 7 November 2023
Tuesday 31 October 2023
Thursday 26 October 2023
Wednesday 25 October 2023
Light Crude Up 17% Since the AI Trade Signal! Winning with AI!
Light Crude Up Since the AI Trade Signal! Winning with AI!
The Volatility Breakout Ai signal up 17.45% in 3 months, and the Swing Trade Ai signal up 16.75% 4 weeks using Artificial Intelligence to generate the trades!

Winning with AI : https://www.metastock.com/alphaharvestf
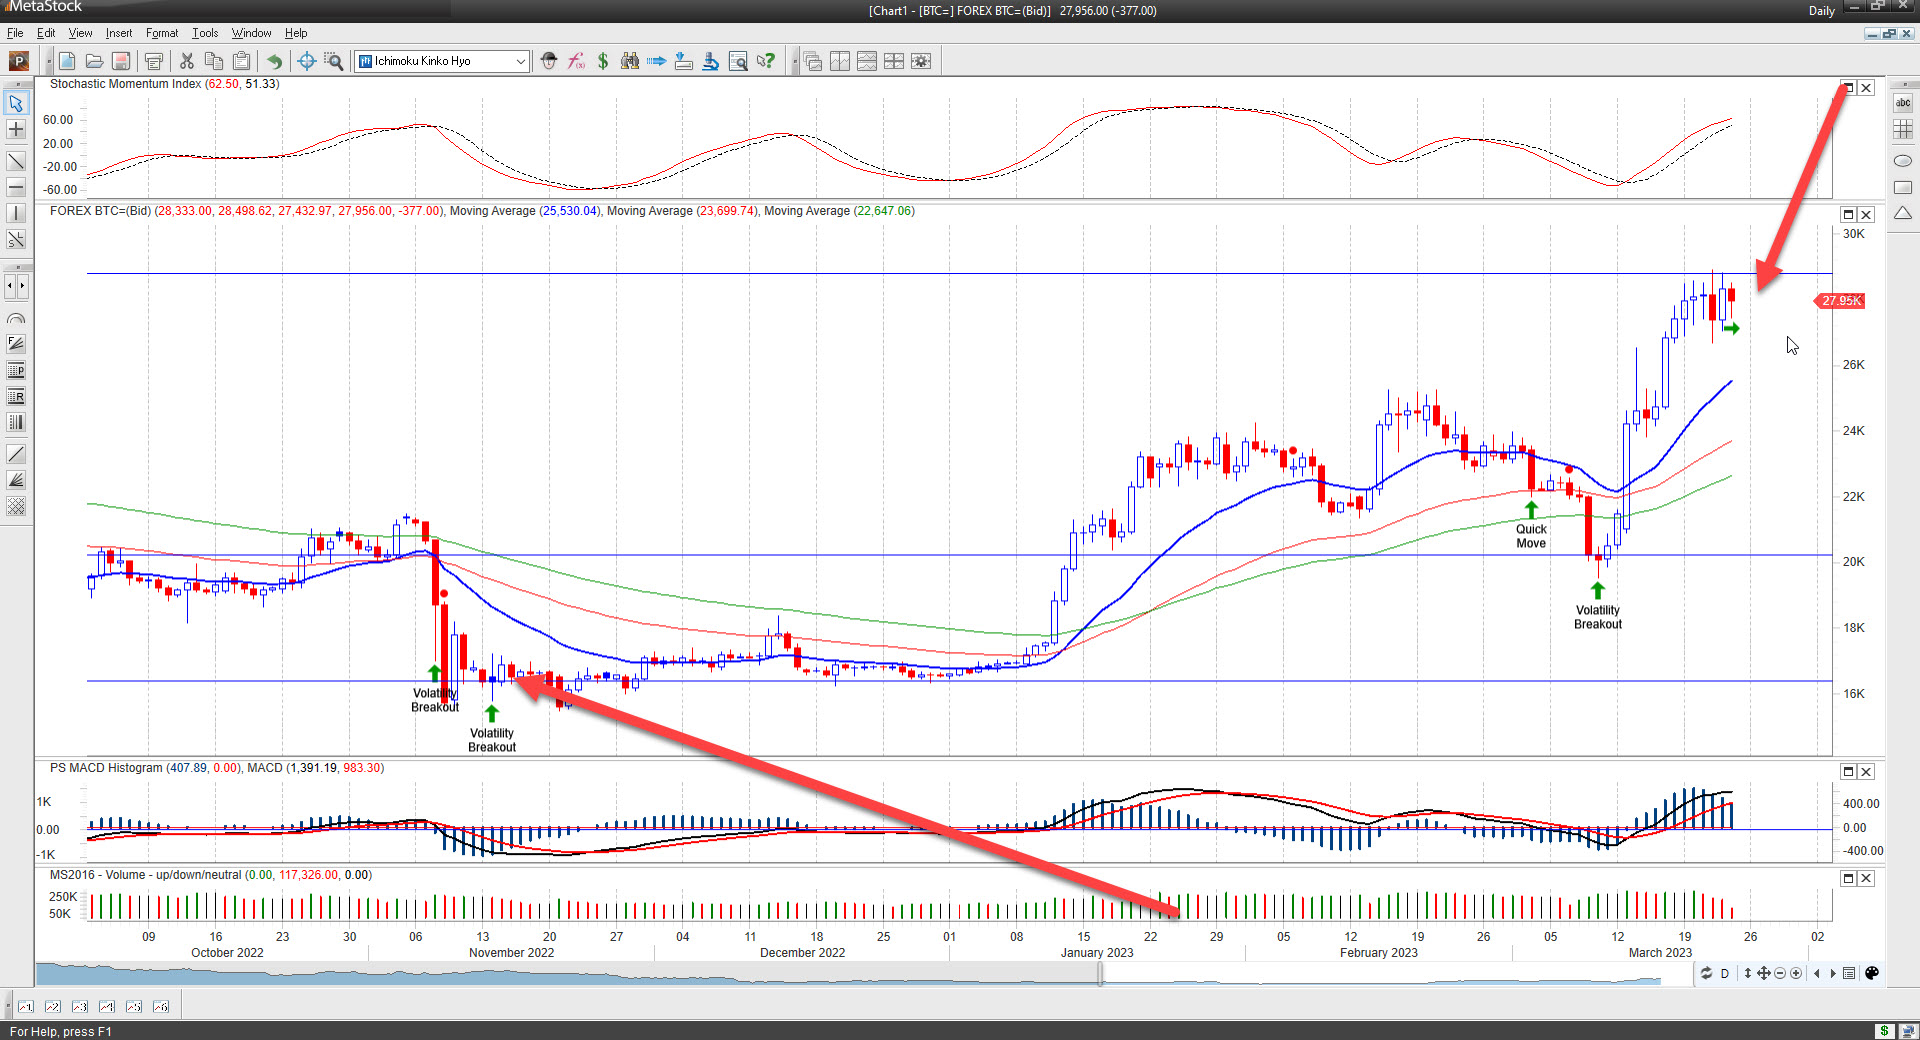
Bitcoin BTCUSD: Artificial Intelligence Triggered a Great Swing Trade in BTC! Winning With AI!
Bitcoin BTCUSD: Artificial Intelligence Triggered a Great Swing Trade in BTC!

Winning With AI! : https://www.metastock.com/alphaharvestf
Tuesday 24 October 2023
Monday 23 October 2023
US 10Y T-Note Hit 5%: The Great Yield Normalization Taking Place as Yields Hit the 5% P&F Chart Targets! Next target: 5.10%/5.45% Risky Times! The J Powell Power Yield Party keeps going!
US 10Y T-Note: The Great Yield Normalization Taking Place as Yields Hit the 5% P&F Chart Targets! Next target: 5.10%/5.45% Risky Times!

Sunday 8 October 2023
Wednesday 4 October 2023
Get ready for the Q4 Rebound! S&P500 index testing support close to the 38%/50% FIB Retracement Zones!
Get ready for the Q4 Rebound! S&P500 index testing support close to the 38%/50% FIB Retracement support zones between 4207/4180! If support holds in this zone then the Q4 rally move right up to the bottom end of the Cloud Chart at 4400 to 4471!

If support holds at this key Fib retracement zone then we can expect a seasonal trend relief rally into the year end!
US 10Y T-Note: The Great Yield Normalization Taking Place as Yields Hit the 4.72% and 4.81% P&F Chart Targets! Next target: 4.96%/5.06% and then 5.43% Risky Times!
US 10Y T-Note: The Great Yield Normalization Taking Place as Yields Hit the 4.72% and 4.81% P&F Chart Targets! Risky Times!.
.jpg)
US 10Y T-Note: Next target: 4.96%/5.06% and then 5.43% The J Powell Power Yield Party keeps going as yields hitting the 4.72% & 4.81% P&F chart targets! Risky Times in the Great Yield Normalization!
Thursday 28 September 2023
US 10Y T-Note: Next target: 4.72%! Yield Party keeps going as yields hitting the 4.19% & 4.31% and 4.49% P&F chart targets! Next targets 4.72% to 4.81%! Risky Times!
US 10Y T-Note: Next target: 4.72%! J Powell Power Yield Party keeps going as yields hitting the 4.19% & 4.31% and 4.49% P&F chart targets! Next targets 4.72% to 4.81%! Risky Times!

Nasdaq 100 Index Fighting hard for a reversal at the 14400 downside P&F chart target zone!
Nasdaq 100 Index fighting hard for a reversal after seasonal weakness towards the 14400 downside P&F chart target zone!

NDX came within 32 points of the 14400 downside P&F chart target in this seasonal weak period in the market. NDX fighting hard for support here. Any upside P&F chart reversal around these levels will signal the end of the downtrend and a possible relief rally in October.
Thursday 21 September 2023
Wednesday 20 September 2023
US 10Y T-Note: J Powell Power Yield Party keeps going as yields hitting the 4.19% & 4.31% P&F chart targets! Next targets 4.49% to 4.72%! Risky times!
US 10Y T-Note: J Powell Power Yield Party keeps going as yields hitting the P&F chart targets! Next targets 4.49% to 4.72/4.8% Risky times!

Light Crude (CLc1) Hit P&F Chart Targets of 91.60 and 93.44! Next upside targets: $97/$99 and $100 to $133!
Light Crude Hit P&F Chart Targets of $91.60 and $93.44! Next upside targets: $97/$99 and $100 to $133!

Currently CLc1 is consolidating after hitting targets. Expect a Fib retracement back down to $90/$87, before the next rally up to the $100 target!
Thursday 7 September 2023
Wednesday 19 July 2023
Nasdaq-100 Index: Hit the 15874 Cloud Chart resistance target zone as AI market euphoria drives the index higher. Party like it is 1999!
Nasdaq-100 Index: Hit the 15874 Cloud Chart resistance target zone as AI market euphoria drives the index higher. Index is now very extended and at a high risk level for a consolidation/correction. Next resistance target 16333 with consolidation risk back down to 15211/14870 and 14482! Party like it is 1999!

Monday 17 July 2023
Friday 14 July 2023
Nasdaq Composite: Rally grinds higher with next key resistance targets 14300/14386 & 14500!
Nasdaq Composite: Rally grinds higher with next key resistance targets 14300/14386 & 14500!
Consolidation risk elevated in view of earnings season and index extended from Cloud Chart support zones.

Thursday 13 July 2023
AAPL: up more than 51% in 6 months since the Artificial Intelligence generated buy signal! Winning with AI!
AAPL: up more than 51% in 6 months since the Artificial Intelligence generated buy signal! Winning with AI!

AAPL ranks in the top 10% of the market with a StarMine ranking of 96, but valuations remains a key concern with a Relative Value rank in the bottom 20% of the market.

AAPL stock buy back program supports the stock price, it also improves earnings per since AAPL's growth has been rapidly decelerating over the last 5 years. The good financial engineers!
Meta: "King of the Social Sewer": Two AI generated trades are up 49% and 62% since the Artificial Intelligence Volatility Breakout Trade Signal! Winning with AI!
Meta: "King of the Social Sewer": Two AI generated trades are up 49% and 62% since the Artificial Intelligence Volatility Breakout Trade Signal! Winning with AI!

Wednesday 28 June 2023
TSLA: Up more than 63% since the Artificial Intelligence generated buy signal! Hit the resistance zones of 266/272 and closed out the Volatility Breakout AI trade! Winning with AI!
TSLA: Up more than 63% since the Artificial Intelligence generated buy signal! Hit the resistance zones of 266/272 and closed out the Volatility Breakout AI trade within that resistance zone! Stock now consolidating, and looking for the next AI generated trade! Winning with AI!

Looking at the Starmine models, TSLA remains expensive and ranks poorly i.t.o Value Momentum, Intrinsic Valuation, Relative Valuation and the Combined Alpha Model. Both EV/EBITDA and P/E Ranks at the bottom end of the range at 9 and 10 global ranking.
Earnings quality remains high with a rank of 97, but the valuation remains a risk!

AAPL: Up more than 48% since the Artificial Intelligence (AI) Swing trade buy signal! Winning with AI!
AAPL: Up more than 48% since the Artificial Intelligence (AI) Swing trade buy signal! Winning with AI!
New trailing stop is around the 180 zone! AAPL stock buyback driving the price higher. Investors piling into AAPL stock as well despite AAPL's y/y earnings and sales declines over the last few years!
AAPL performed very well since the AI generated Swing Trade signal! So far so good. Winning with AI!

The AI captures great trades even on the weekly charts:

On the 4 hour charts the AI generates a lot of really great trades.

AAPL's Starmine Valuation and Momentum rank is 10, and the Intrinsic Valuation rank is 11 with the Relative Valuation Rank of 16. This is overall bearish from a valuation perspective.

https://www.metastock.com/alphaharvestf
Tuesday 13 June 2023
Nasdaq 100 Index: Becoming extended as the NDX is hitting upside CC resistance target resistance zone : 14870/14480.
Nasdaq 100 Index: Becoming extended as it is hitting upside CC resistance target resistance zones : 14870/14480. Consolidation risk high here since the NDX is within a CC resistance zone as well as being very extended from the top end CC support zone!


Thursday 8 June 2023
Microsoft MSFT Artificial Intelligence generated trades up 45%, 42%, 35% & 25% respectively! Winning with AI!
Microsoft MSFT Artificial Intelligence generated trades up 45%, 42%, 35% & 25% respectively! Winning with AI!

Major Reversal AI Strategy trade up by 45.2%
Swing Trade AI Strategy trade up by 42.6%
Volatility Breakout AI Strategy up by 35.2% and 25.2%
So far so good, winning with AI!
Apple AAPL up more than 42% since the Artificial Intelligence (AI) Swing Trade buy signal! Winning with AI!
Apple AAPL up more than 42% since the Artificial Intelligence (AI) Swing Trade buy signal! Winning with AI!

NVDA up more than 121% and 67% in a few months since the Artificial Intelligence (AI) trade signals! Winning with AI!
NVDA up more than 121% and 67% in few a months since the AI Volatility Breakout trade signals! Winning with AI!

TSLA up more than 30%/40% in few weeks since the AI trade signal! Winning with AI!
TSLA up more than 30%/40% in few weeks since the AI trade signal! Winning with AI!
TSLA up by 37% and 43% after two Volatility Breakout AI generated trade signals! Winning with AI!

S&P500 index running into CC resistance zones 4271/4315! Consolidation risk back down to CC support zones 4157/4066 if resistance holds!
S&P500 index running into Cloud Chart (CC) resistance zones 4271/4315! Consolidation risk back down to CC support zones 4157/4066 if resistance holds!

Good news is that as long as price action is above the cloud the new bull rally is ok for now!
Nasdaq 100: Cloud Chart resistance zones 14485/14872 putting the brakes on the rally. Downside risk 13900/13607!
Nasdaq 100: Cloud Chart resistance zones 14485/14872 putting the brakes on the rally. Downside risk 13900/13607 if resistance holds!

Wednesday 7 June 2023
Tuesday 6 June 2023
Thursday 25 May 2023
Tuesday 25 April 2023
Monday 17 April 2023
Tuesday 11 April 2023
Thursday 6 April 2023
Nvidia NVDA.O: Up +147% on WCC and +100% on DCC buy signals. Now in profit taking resistance zones of 266/277&284! Consolidation risk remain high here!
NVDA.O: Up +147% on weekly Cloud Chart (WCC) and +100% on the daily Cloud Chart (DCC) buy signals. Now in profit taking resistance zones of 266/277&284!

Consolidation risk remain high here back down to the top end Cloud Chart support zone of 243 on WCC, and 251 on the daily CC!

META.O "King of the Social Sewer Stocks": up +130% since the CC rebound buy signal! Now close to next major resistance zone: 221!
META.O "King of the Social Sewer Stocks": up +130% since the Cloud Chart (CC) rebound buy signal! Now close to next major resistance zone: 221!

Meta had a strong rebound from the Cloud Chart support zone of 91/96 zone! Meta managed to break past the bottom end CC resistance zone and now on it way to fight resistance at the top end of the weekly CC resistance zone between 208/221!
Need to see a sustained breakout past the top end CC resistance zone! Consolidation risk remain high in and around resistance targets!
Wednesday 5 April 2023
Thursday 30 March 2023
Wednesday 29 March 2023
FTSE100 Futures: AI generated Swing trade signal on 4H chart still active in the FTSE100 futures contract. Keep a tight volatility adjusted training stop active! Winning with AI!
FTSE100 Futures: AI generated Swing trade signal on 4H chart still active in the FTSE100 futures contract. Keep a tight volatility adjusted training stop active! Winning with AI!

So far so good artificial intelligence generates great high probability trades on the FTSE 100 Index futures contract.

On average the AI Major Reversal AI signal is about 70% accurate on average, and the Swing trade one 68% on average. Winning with AI!
Xetra Dax Index: Waiting patiently for the next high probability AI generated trade on the Xetra Dax index futures contract on the 3 hour chart!
Xetra Dax Index: Waiting patiently for the next high probability AI generated trade on the Xetra Dax index futures contract on the 3 hour chart!
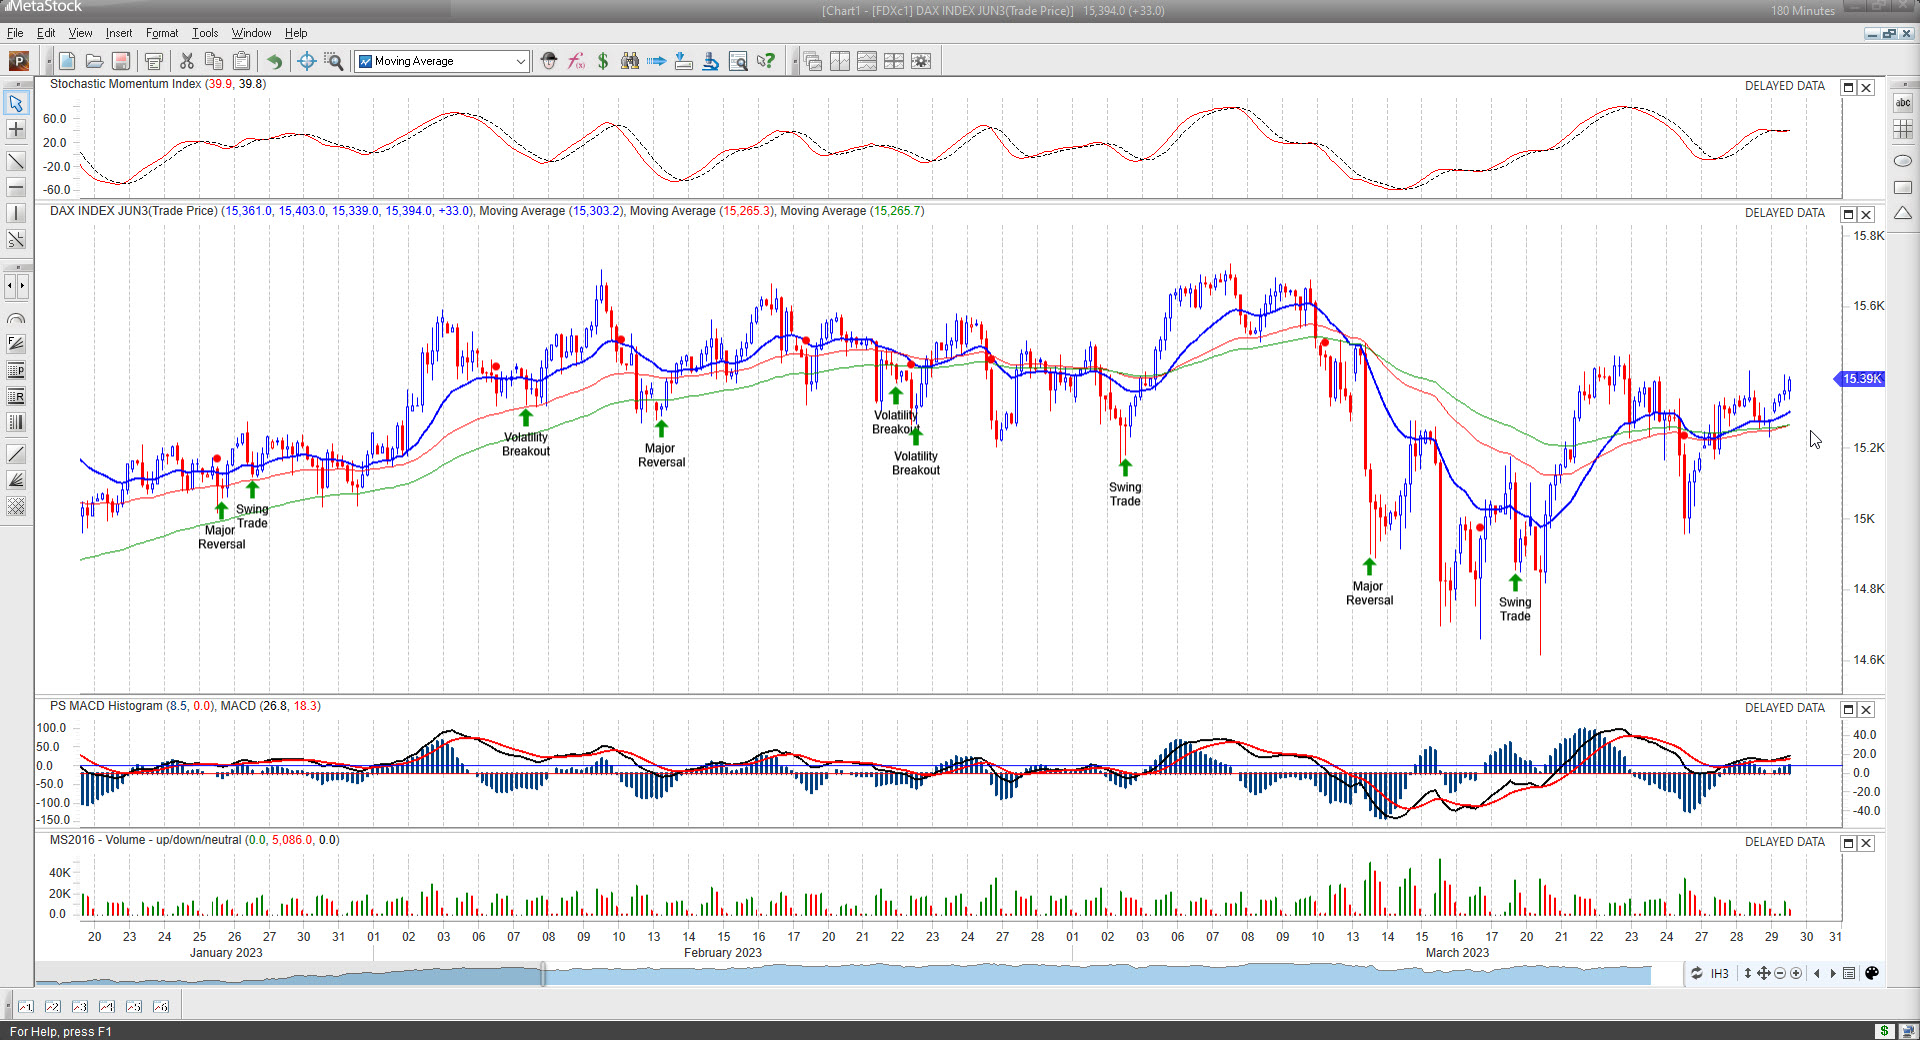
So far so good artificial intelligence generates great high probability trades on the Dax futures contract.
On average the AI Major Reversal AI signal is about 70% accurate on average, and the Swing trade one 68% on average. Winning with AI!

Tuesday 28 March 2023
Monday 27 March 2023
Friday 24 March 2023
Bitcoin BTCUSD Up by more than 70% since the VB AI buy signal! Now hitting 28800 resistance zone consolidation risk remain high here!
Bitcoin BTCUSD Up by more than 70% since the VB Artificial Intelligence (AI) buy signal! Now hitting 28800 resistance zone consolidation risk remain high here!
The weekly chart shows the 28800 resistance where BTC needs to break past! Critical week ahead!

Thursday 23 March 2023
Wednesday 22 March 2023
PALO Palo Alto Networking: VB & ST Artificial Intelligence Trade signals are generating some great trades in PALO!
PALO Palo Alto Networking: Volatility Breakout & Swing trades Artificial Intelligence Trade signals are generating some great trades in PALO! So far so good. Winning with AI!

Arista Networks ANET: Great rallies after the VB AI trade signals! Now moving into profit taking zone!
Arista Networks ANET: Great rallies after the VB Artificial Intelligence (AI) trade signals! ANET bit extended now and moving into profit taking zone! Consolidation risk remain high here!

Nvidia NVDA up more than 122% since the AI buy signal! Now moving into profit taking resistance zone between $276/$289. Keeping trailing stop tight here!
Nvidia NVDA up more than 122% since the Artificial Intelligence (AI) buy signal! Now moving into profit taking resistance zone between $267/$289. Keeping trailing stop tight here! Winning with AI!


Tuesday 21 March 2023
Monday 20 March 2023
Xetra Dax Index: After more than a 900 point drop since the CC sell signal the Dax is fighting hard to rebound from a key CC support zone of 14484/14571. Rebound rally coming if support holds!
Xetra Dax Index: After more than a 900 point drop since the Cloud Chart (CC) sell signal the Dax is fighting hard to rebound from a key CC support zone of 14484/14571. Rebound rally coming if support holds!

S&P500 Index futures: Rebounded from 3900 zone now fighting hard to break past top end CC resistance: 3945!
S&P500 Index futures: Rebounded from 3900 zone now fighting hard to break past top end Cloud Chart (CC) resistance: 3945! Need to see a sustained breakout past this CC resistance zone, that will be very bullish from a CC perspective! Critical week ahead!

Downside risk remains in place towards the bottom end of the front end of the cloud!
FTSE100 Index: Fighting hard for support at a 7292/7225 CC support zone! Rebound rally coming if support holds at this range!
FTSE100 Index: Fighting hard for support at a 7292/7225 Cloud Chart (CC) support zone! Rebound rally coming if support holds at this range!
This comes soon after hitting a sell signal when the FTSE100 lost support at the bottom end of the cloud! The other major sell signal was around the 8000 zone and then again at 7600 zone.
If support holds can see a rebound relief rally towards the upside resistance zones of 7438/7587 and the bottom end of the CC at 7675.

Risk remain in place since price action is below the cloud and that remains bearish long-term on the daily CC chart. Short-term rebound swing trades are the best strategy around support levels.
So far so good the FTSE100 is testing support at a critical CC level on the weekly CC. Rebound potential here if support holds.

CS Group: Credit Suisse down more than 92% since CC sell signal! Fat cat bankers make great shorts!
CS Group: Credit Suisse down more than 92% since CC sell signal! Fat cat bankers make great shorts!
CS group down by more than 92% on both the two most recent sell signals using the Cloud Chart trading algorithm!

Wednesday 15 March 2023
S&P500 Index futures rebounded from CC support target 3809! Now fighting hard for support at 3847/3839 CC support zone! Rebound potential if support holds!
S&P500 Index futures rebounded from CC support target 3809! Now fighting hard for support at 3847/3839 CC support zone! Rebound potential if support holds!

Rebound swing trade from these key levels back up to the next upside resistance zone of 3914/3918/3926 if support holds!
Downside risk to retest the 3809 CC support zone if support fails at 3839! Risk remain high since price action is below the Cloud!
Xetra Dax: Down more than 700 points since the CC resistance zone sell signal! Rebounded from front cloud support at 14727! Critical to stay above this key support zone!
Xetra Dax: Down more than 700 points since the Cloud Chart (CC) resistance zone sell signal! Rebounded from front cloud support at 14727! Critical to stay above this key support zone!
Rebound support zones at 14790/14727/14659. Critical that the Dax remains above these levels!
