Tuesday 22 November 2022
Monday 21 November 2022
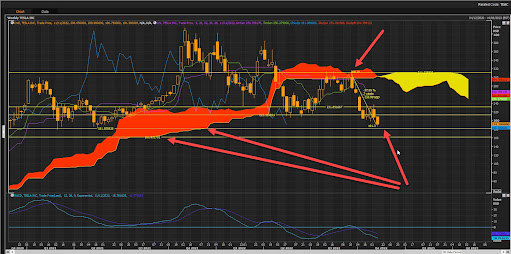
TSLA: Bear rally accelerating towards next Cloud Chart target of $161! More downside risk to $156!
TSLA: Bear rally accelerating towards next Cloud Chart target of $161!
This comes soon after hitting the 213/195/181 & 173 downside CC risk targets! TSLA down more than 45% since the CC sell signal!
Looking out for a potential rebound rally close to the $161 support zone!
There is a major CC support zone on the monthly CC at $156! This level is a major front CC support zone as well as the standard line of the cloud. Downside risk to this level on the monthly chart! Major rebound potential from the $156 zone!
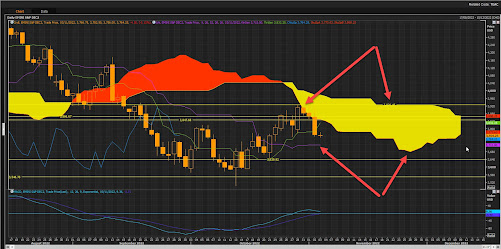
Light Crude Oil: Down +14% since the Cloud Chart sell signal! Downside risk $73/$70 old CC support zones!
Light Crude Oil: Down +14% since the Cloud Chart (CC) sell signal! Downside risk $73/$70 old CC support zones!
Crude oil down 14% since the CC sell signals on the 4 hour CC. Downside risk towards the next key old CC support zones of 73.9/70.82!
Price action below the cloud remains bearish. Rebound potential at key CC support zones!
The daily CC identifies the potential support zones from the old January 2022 CC support base!
Thursday 17 November 2022
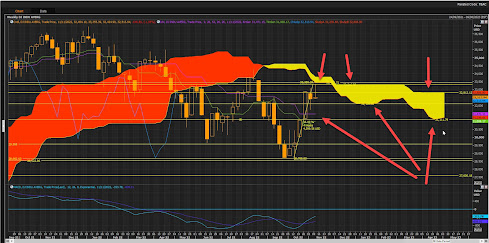
Xetra Dax Futures: Hitting top end Cloud Chart resistance zone after a 2300+ point rebound rally! Reversal risk high if resistance holds at 14361!
Xetra Dax Futures: Hitting top end Cloud Chart resistance zone after a 2300+ point rebound rally! Reversal risk high if resistance holds at 14361! Rebound rally moving into profit taking resistance zone!
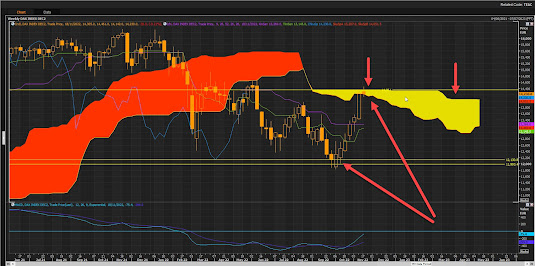
Nasdaq Composite Index: Having a hard time to get past Cloud Chart resistance zones! Risky times!
Nasdaq Composite Index: Having a hard time to get past Cloud Chart resistance zones! Risky times!
After a great rebound rally from old Cloud Chart (CC) support zones below the cloud, the IXIC managed to break past the bottom end CC resistance zone! The cloud is quite thick so it will take a significant rally to break past this resistance zone.
Recently the IXIC ran into trouble at old resistance zone of 11425/11445! It consolidated the recent move and now testing the front CC support zone of 11181! There is still downside risk towards the bottom end of the cloud. If support holds at these key CC levels we can expect another rally attempt to break past resistance at the top end of the cloud!
Wednesday 16 November 2022
Goldman Sachs: Rebound rally up +32% now getting into key Cloud Chart resistance zones of 393! Consolidation risk remain high here!
Goldman Sachs: Rebound rally up +32% now getting into key Cloud Chart resistance zones of 393! Consolidation risk remain high here!
GS rallied more than 32% from old Cloud Chart (CC) support zones. Managed to break past the weekly CC resistance. New support zones are 372/351. GS now getting closer to the old CC top end resistance zones of 393!
Moving into swing trade profit taking zone on the daily CC since GS bit extended from the top end of the cloud. Consolidation risk down to 372 and the front end of the cloud at 351! Price action is still above the cloud and that remains bullish but do expect some consolidation of the recent rally move. 393 is the upside resistance target!
JPM: Rebound rally running into Cloud Chart resistance at 135 zone! JPM up +28% since the Cloud Chart support rebound!
JPM: Rebound rally running into Cloud Chart resistance! JPM up +28% since the Cloud Chart support rebound!
After finding support at the old CC support zones of 105/09, JPM rallied more than 28% and is now fighting resistance at the bottom end of the CC. Consolidation risk high here if resistance holds.
JPM moving into swing trade profit taking zone after becoming extended from the top end of the CC on the daily CC. Downside risk towards 129 and then the front Cloud support zone of 124!
Tuesday 15 November 2022
Monday 14 November 2022
S&P500 Index Futures: Grinding higher towards the next Cloud Chart resistance zones 4042/4238!
S&P500 Index Futures: Grinding higher towards the next Cloud Chart resistance zones 4042/4238!
S&P500 Index: Grinding higher towards the next Cloud Chart resistance zones the bottom end of the weekly CC: 4042, with the top end CC level of 4238 as another major resistance zone!
So far the rebound rally from the 3548 support zone yielded some great swing trades.
The good news is that the S&P500 index is trading above the top end of the CC on the daily CC. This is bullish. As long as the price action remains above the Cloud the rally should be ok into the year end.
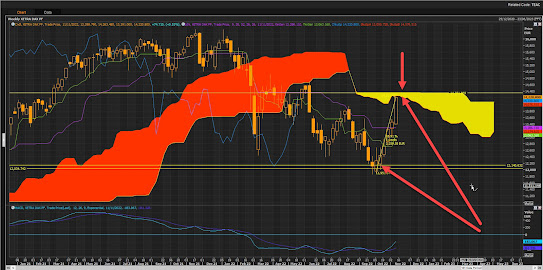
DJI: Dow Jones Index rebound rally running into Cloud Chart resistance! Critical week ahead!
DJI: Dow Jones Index rebound rally running into Cloud Chart resistance! Critical week ahead!
DJI: Dow Jones Index rebound rally running into Cloud Chart (CC) resistance at the bottom end of the weekly CC. Need to see a breakout past this level to change the outlook from bearish to bullish. If resistance holds then expect a reversal back down to the front cloud support zones!
If the DJI manages to break past the top end CC resistance then the outlook changes to bullish from bearish on the weekly CC. Critical week ahead!
Friday 11 November 2022
Xetra Dax: Rebound rally up more than 2200 points since the Cloud Chart support rebound trade! DAX close to top end cloud chart 14351 resistance zone!
Xetra Dax: Rebound rally up more than 2200 points since the Cloud Chart support rebound trade! DAX close to top end cloud chart 14351 resistance zone!
Moving into profit taking zone! Need to see a breakout past the top end Cloud Chart resistance zone for the Dax to change to bullish on the weekly CC.
NASDAQ Composite Index: Rebound rally heading towards major Cloud Chart resistance!
NASDAQ Composite Index: Rebound rally heading towards major Cloud Chart (CC) resistance!
The rebound rally now getting closer to major CC resistance at the bottom end of the cloud! Need to see a breakout past these cloud chart levels for the market to be back in bullish territory. Not out the woods yet!
S&P500 Futures: Great rebound from key Cloud Chart support zones! Great news back above the top end of the Cloud! 4000 next key resistance zone to break past!
S&P500 Futures: Great rebound from key Cloud Chart support zone! Great news back above the top end of the Cloud! 4000 next key resistance zone to break past!
S&P 500 index futures rebounded from the 3548 Cloud Chart (CC) support zone! More recently managed to rebound from the front CC support zones of 3749! S&P500 also managed to break past top end CC resistance zone of 3957! Now it is at a critical zone to find support at. Need to see a follow-through rally above the cloud now. Outlook is back in bullish territory on the daily CC as long as the S&P500 stays above this support zone!
S&P500 index futures now need to break past the 4001/4042 old CC resistance zones!
On the weekly CC upside resistance targets are at the bottom end of the cloud at 4042 and 4161/4238 at the top end of the CC.
If support holds above the daily CC the rally can last up to the 4238 resistance zone!
Thursday 10 November 2022
DJI: Dow Jones Index 4500+ point rebound rally ran into Cloud Chart resistance! Downside risk to front cloud potential support zones!
DJI: Dow Jones Index 4500+ point rebound rally ran into Cloud Chart (CC) resistance!
Downside risk to front cloud potential support zones of 32106 then the standard line of the cloud at 31471 and if support fails there as well the next key downside risk zone is 31111 the front end bottom cloud support zone!
Price action is below the weekly cloud and that remains overall bearish!
The DJI is still trading above the top end of the cloud on the daily CC and this is bullish. Potential support zones to be tested are 32217/31963 old CC resistance zones, if support fails there then downside risk towards the top end of the front end of the cloud at 31482 where we can see a rebound if support holds and then a rally into the year end.
Wednesday 9 November 2022
TSLA: Down 37.9% since the Cloud Chart resistance sell signal! Downside risk to 181/161 old Cloud Chart support zones!
TSLA: Down 37.9% since the Cloud Chart resistance sell signal! Downside risk to 181/161 old Cloud Chart support zones!
TSLA: Down 37.9% since the Cloud Chart (CC) resistance sell signal at the top end of the weekly cloud the 311 resistance zone! The second sell signal was when TSLA sliced past the bottom end CC support zone at 298! Price action below the cloud confirmed the bearish outlook and activated the downside CC support risk targets of 213/205 and 195 with all these targets being met!
The next two key levels to keep and eye on are : 181/161 old Cloud Chart support zones!
Could see a technical rebound rally from this range of 195/181 support zones! The new risk range is between 161/181 to 213/231!
But the long-term outlook remains bearish since price action is below both the weekly and daily Cloud Charts!
Tuesday 8 November 2022
Dow Jones 30 Index Up more than 4000 points since the Cloud Chart support rebound trade!
Dow Jones 30 Index Up more than 4000 points since the Cloud Chart support rebound trade!
DJI getting closer to the bottom end front cloud chart resistance zones! Need to see a breakout past these Cloud Chart resistance zones for the outlook to change to bullish from bearish on the weekly Cloud Chart!
But it's been a great swing trade rally below the cloud!
Carvana: "The Carvana Con": Stock down 98% since the Cloud Chart Sell signal! Used car sales business... no need to say more the signs were there!
Carvana: "The Carvana Con": Stock down 98% since the Cloud Chart Sell signal!
In fact there were 3 Cloud Chart sell signals! All down 98.09%, 97.04% & 97.15%
Used car sales business...not to mention the backgrounds of the management involved.. no need to say more the signs were there!!!
Monday 7 November 2022
META.O Down more than 75% since the Cloud Chart Sell signal! Well done Zuckerberg!
META.O Down more than 75% since the Cloud Chart Sell signal! Well done Zuckerberg!
META also reached the downside P&F chart targets of 130/126/121/114 to 100 and now the 91 downside target! Looking out for a P&F chart reversal to signal the end of the trend and a new swing trade opportunity to the upside!
Thursday 3 November 2022
Xetra Dax Reversed lower after hitting upside Cloud Chart resistance zone at 13416! Consolidation risk towards: 12904!
Xetra Dax Reversed lower after hitting upside Cloud Chart (CC) resistance zone at 13416! Consolidation risk towards: 12904 top end of the CC support zone! Critical for support to hold at this zone and a potential rebound trade opportunity! This comes after a great rebound rally trade from the 12032 support zone!
Nasdaq Composite: Reversed lower after hitting Cloud Chart resistance zones:11154/11192! Critical support zone on the 4 H Cloud Chart!
Nasdaq Composite: Reversed lower after hitting Cloud Chart resistance zones:11154/11192.. the bottom end front cloud chart resistance zones!
On the 4 hour Cloud Chart the index testing support at the bottom end of the cloud at 10512! Can see a rebound here if support holds. Bearish outlook remain in place since price action is below the cloud. Rebound swing trade possible from this level if support holds.
On the daily cloud chart bottom end cloud chart resistance held at 11154/11192! Testing support at the 10542 old standard line support zone on the cloud chart.
Downside risk towards old cloud chart support zones of 10399/10215! Price action below the cloud remains bearish with old support zones offering rebound swing trades!
S&P500 Futures pulled back after hitting Cloud Chart resistance zone: 3926! Downside risk: 3715/3679!
S&P500 Futures pulled back after hitting Cloud Chart resistance zone: 3926, the top end of the front cloud chart resistance zone held!
Downside risk: 3715 the standard line of the cloud, where we can expect some form of support being tested. If support fails at that level then downside risk towards the bottom end of the front end of the cloud is the next support target :3679!
Price action below the cloud remains bearish with swing trade opportunities back up to the bottom cloud chart resistance zones!


