Friday 30 September 2022

FTSE100 On its way to test 6788 support zone! FTSE10 down more than 8% since the last long-term sell signal! TruKwartus caused a LizKwasi!

 FTSE100 On its way to test 6788 support zone! FTSE100 down more than 8% since the last long-term sell signal! TruKwartus caused a LizKwasi!

Price action below the cloud and that remains bearish. If support comes in at around the 6788 zones then the swing trade upside potential is 7000 resistance zone, and the bottom end of the cloud at 7125/7204 and 7292!


TruKwartus caused a LizKwasi!


US Dollar Index: Hitting P&F chart targets 109/111/112, as the rally keeps going! Next upside targets 117/120 & 122!

 US Dollar Index: Hitting P&F chart targets 109/111/112, as the rally keeps going! Next upside targets 117/120  & 122!


P&F trend line are key support levels for consolidation rebounds!


FTSE100 Hitting 6900 P&F chart target! FTSE100 down more than 8% since the P&F chart sell signal!

 FTSE100 Hitting 6900 P&F chart target! FTSE100 down more than 8% since the P&F chart sell signal!


Downside risk to the trend line support zone of 6750. Looking out for a P&F chart reversal to the upside to signal the end of the current trend. Downside risk towards next key targets of 6550/6350! Rebound potential in and around targets for a technical retracement!


Xetra Dax Index Hit the 12200/12100 & 11900 P&F chart targets! Downside risk towards trend line zones of 11500/11200!

 Xetra Dax Index Hit the 12200/12100 and 11900 P&F chart targets! Downside risk towards trend line zones of 11800 to 11500/11200!

GDAXI down more than 1500 points since the most recent P&F chart reversal sell signal! Index remains in a downtrend channel as indicated by the P&F chart trend lines! 


Very close to the 11800 P&F chart target. Looking out for a potential technical rebound in and around these P&F chart targets. A key P&F chart reversal to the upside will signal the end of the current trend.


Thursday 29 September 2022

Nasdaq Composite Index Hitting 10800/10700 P&F chart targets zones! Downside risk towards 10100/8600!

 Nasdaq Composite Index (IXIC) Hitting 10800/10700 P&F chart targets zones! Downside risk towards 10100/8600!

10100 level is a key potential support zone that can still be tested! P&F trend line still remain bearish, with the IXIC down more than 17% since the P&F trend line resistance sell signal!


Looking out for a P&F chart reversal to the upside to signal the end of the current trend! 

Dow Jones Index hit the 29500/29250/29000 P&F chart targets. DJI fighting hard for support after hitting targets! Looking out for a P&F chart reversal to the upside to signal the end of the trend.

 Dow Jones Index hit the 29500/29250/29000 P&F chart targets. DJI fighting hard for support after hitting targets! Looking out for a P&F chart reversal to the upside to signal the end of the trend. If a reversal takes place then the upside target will be around the next P&F chart resistance level of 31250!


If support fails here the next downside P&F chart targets are 28250/27250 with downside risk towards 25750/24000! 

Wednesday 28 September 2022

Light Crude CLc1 Down more than 25% since the cloud chart sell signal! On its way to test support at 73.9/70.82!

 Light Crude CLc1 Down more than 25% since the most recent cloud chart sell signal! On its way to test support at 73.9/70.82 old cloud chart support zones of January 2022!

Crude is down more than 35% since the initial sell signal above the cloud!


Chart data source: Eikon and MetaStock: https://www.metastock.com/alphaharvest3for1

Dow Jones Index hit the 29250 P&F chart target! Next targets 29000/28250/27250! Index down more than 13% (4450+ points) since the most recent P&F chart sell signal!

 Dow Jones Index hit the 29250 P&F chart target! Next targets 29000/28250/27250! Index down more than 13% (4450+ points) since the most recent P&F chart sell signal!


Looking out for a P&F chart reversal to the upside to signal the end of the current trend!


Xetra Dax 40 Index : Heading towards next P&F chart target of 11800/11500 & 11200! Down more than 25% (4000 points) since the P&F chart sell signal!

 Xetra Dax 40 Index : Heading towards next P&F chart target of 11800/11500 & 11200! 


Xetra Dax now down more than 25% (4000 points)  since the P&F chart sell signal!

Looking out for a P&F chart reversal to signal the end of the trend!

FTSE100: Downside risk to next P&F chart targets of 6750/6550 and 6350!

 FTSE100: Downside risk to next P&F chart targets of 6750/6550 and 6350! FTSE100 down more than 8% since the P&F chart sell signal!


Looking out for a P&F chart reversal to signal the end of the trend!

US 10Y T-Note: And the winning number is: 3.975%. Yields hitting the P&F chart targets! Next targets 4.9% to 5.9%! Risky times!

 US 10Y T-Note Yield Party keeps going as yields hit the P&F targets of 3.975%! This comes soon after yields hit the 3.6%/3.7% P&F chart targets! 

Beware the much higher targets of 4.9%  to 5.9% Risky times as the yield party keeps going and going! A P&F chart reversal will signal the end of the current trend! 


Tuesday 27 September 2022

GBPUSD: Artificial Intelligence algorithm identifying great trades on the GBPUSD forex pair!

 GBPUSD: Artificial Intelligence algorithm identifying great trades on the GBPUSD forex pair!


Daily AI signals: 


4 Hour Chart AI Signals:


3 Hour Chart AI Signals

1 Hour Chart AI Signals


Plenty of buy and sell signals as well as short selling signals using AI!

S&P500 Downside risk towards 3500! Cloud Chart Trading Review 27th Septe...

S&P500 Downside risk towards 3500! Cloud Chart Trading Review 27th Septe...

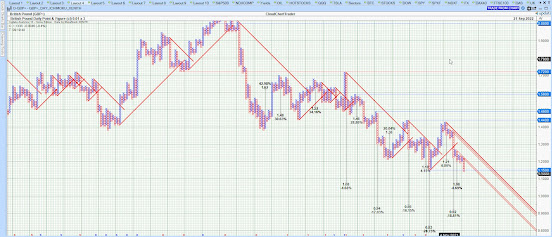
GBPUSD down more than 22% (3000 points) as TruKwartus caused a LizKwasi!

 GBPUSD down more than 22% (3000 points) as TruKwartus caused a LizKwasi! 


GBPUSD was down as much  as 22% since the cloud  chart sell signal hitting the lows of  1985! 


GBPUSD also hit the downside P&F chart targets of 1.08 and 1.076/1.039! Downside risk towards 0.95/0.92 the next P&F chart targets! Looking out for a P&F chart reversal to signal the end of the trend!


Key cloud chart resistance levels on the 4 hour cloud chart are 1.0771/1.0881 and top end of the front cloud chart resistance zone of 1.0985.


TruKwartus caused a LizKwasi! 


Monday 26 September 2022

GBPUSD: Hit the 1.08 & 1.039 P&F chart targets as a vote of no confidence in Truss & Bailey!

 GBPUSD: Hit the 1.08 & 1.039  P&F chart targets as a vote of no confidence in Truss & Bailey!


The other P&F chart targets are 0.95 to 0.92!

GBPUSD hit the 1.076 and 1.039 P&F chart targets! Downside risk on the 60M P&F chart towards 1.025/0.952!


Friday 23 September 2022

US 10Y T-Note Yield Party keeps going as yields hit the P&F targets of 3.6%/3.7%! Beware the much higher targets of 3.975% & 4.9 to 5.05%! Risky times!


US 10Y T-Note Yield Party keeps going as yields hit the P&F targets of 3.6%/3.7%! Beware the much higher targets of 3.975% & 4.9 to 5.05%!  Risky times!


FTSE100: Down more than 6% (464 points) since the Cloud Chart sell/short signal! Liz Whizz short trade!

 FTSE100: Down more than 6% (464 points) since the Cloud Chart sell/short signal! 

The Liz Whizz competence trade working out well! 


If support fails at the 7005 zone, the FTSE100 is whizzing down towards 6891/6786 and 6750 as the next key cloud chart support zones to be tested!


Wednesday 21 September 2022

GBPUSD: The Liz Whizz Sterling now down more than 15% (2136 points) since the cloud chart sell signal! What a great short!

 GBPUSD: Sterling now down more than 15% (2136 points) since the major cloud chart sell signal! What a great short! 


The Liz Whizz will turn the UK into a major emerging market export nation eventually as lower P&F chart targets are winking at Sterling!

Downside P&F chart targets in the current downtrend is at 1.08/0.95 with lower targets of 0.92 and 0.83!

GBPUSD met the recent P&F chart targets of 1.21 and 1.18! 

The Liz Whizz Sterling trade! 


Tuesday 20 September 2022

Monday 19 September 2022

Light Crude Down more than 28% since the Cloud Chart sell signal! On its way to test support at $80/$73 zones!

 Light Crude Down more than 28% since the Cloud Chart sell signal! Bearish outlook remains in place since price action is below the cloud! 

Next key old cloud chart support zones are at around $80 and the next one at the $73 zones! 


S&P500 Index: Fighting the bears below the bottom end cloud chart zone!

 S&P500 Index: Fighting the bears below the bottom end cloud chart zone! 

S&P500 back in bearish territory since losing support at the bottom end of the cloud chart support zone at 3907!

On its way to test old cloud chart support zones of 3847/3825/3805! Outlook remains bearish on the daily and weekly cloud charts! 


Wednesday 14 September 2022

US 10Y T-Note Hitting P&F targets of 3.325% to 3.375% with much higher targets of 3.65%/3.975%! Risky times!

 US 10Y T-Note Hitting P&F targets of 3.325% to 3.375% with much higher targets of 3.65%/3.75 and 3.975%! Risky times!


https://cloudcharts.blogspot.com/2022/08/us-10y-t-note-next-p-targets-are-3325.html


Nasdaq100: Reversal of Fortune as the index hit cloud chart resistance and reversed back into bear market territory!

 Nasdaq100: Reversal of Fortune as the index hit cloud chart resistance and reversed back into bear market territory!


After a fantastic rebound rally from key cloud chart support zone at the bottom end of the cloud the index ran into trouble at old cloud chart resistance zones of 12664/12777 !

After higher than expected inflation figures the NDX reversed lower and lost support at the bottom end of the cloud and since price action is below the cloud the overall outlook is back into bearish territory!

The outlook remains bearish on the weekly cloud since price action is trading below the cloud. 

Short-term swing trades in the daily and 4 hour cloud chart at key opportunities to take, but overall the bearish outlook remain in place. Key levels for a potential support test are at 11971/11851!


Tuesday 13 September 2022

Nasdaq Futures up more than 770 points since the cloud chart support rebound buy signal!

 Nasdaq Futures up more than 770 points since the cloud chart support rebound buy signal! 

NDX is now getting closer to key cloud chart resistance zones at the standard line of the cloud as well as the front end cloud chart resistance zones: 12839 to 13060 resistance zones! 


Xetra Dax Futures up more than 750 points since the cloud chart support rebound buy signal!

 Xetra Dax Futures up more than 750 points since the cloud chart support rebound buy signal!

Xetra Dax Futures up more than 750 points since the cloud chart support rebound buy signal on the 4 hour cloud chart. 


Old support levels held and the DAX rebounded from the 12684 support zones. Dax is now heading closer to the next key cloud chart resistance zones of 13522 and 13543! 


DAX is still below weekly cloud and that is bearish, but price action on the daily cloud is getting closer to a major resistance zone that if the DAX manages to break past this zone the outlook will change to bullish on the daily! But we need to see the breakout past this top end cloud chart resistance zone!


Monday 12 September 2022

Nasdaq100 Futures up by more than 500 points since the AI buy signal!

Nasdaq100 Futures up by more than 500 points since the AI buy signal on the 3 hour chart!! 
Winning with AI! 

Xetra Dax Futures: Up more than 590 points since the AI buy signal!

Xetra Dax Futures: Up more than 590 points since the artificial intelligence (AI) volatility strategy buy signal on the 3 hour chart! Winning with AI!
https://www.metastock.com/alphaharvest3for1

Nasdaq100: Great swing trade rebound trade from a key cloud chart support zone!

 Nasdaq100: Great swing trade rebound trade from a key cloud chart support zone at 11971 (swing trade up more than 590 points)! Next key resistance zones at the front end of the cloud at the turning line of 12815 and the top end of the front end of the cloud: 13094! As long as price action stays above cloud the bull rally remains in place! 


S&P500: Great swing trade rebound from the bottom end cloud chart support zone!

 S&P500: Great swing trade rebound from the bottom end cloud chart support zone of 3907! Swing trade up more than 160 points! Now S&P500 is getting closer to upside resistance at the front end cloud chart resistance zone of 4076/4108 and then 4173 resistance zones! 


Friday 2 September 2022

TSLA: Getting closer to critical cloud chart support rebound zones 263/259!

 TSLA: Getting closer to critical cloud chart support rebound zones 263/259! 

Potential rebound swing trade potential from this cloud chart support zones on the daily cloud chart. 

TSLA needs to keep trading above the cloud to maintain a bullish outlook. Any price action below the cloud will change the outlook to bearish! 

Recently TSLA went up by more than 40% since rebounding from a key cloud chart support zone around 213! Only to run into resistance at the old cloud chart resistance levels of 308! 

The next potential swing trade is a rebound from the old cloud chart support levels 263/261/259!


Long-term the weekly cloud chart remains bearish as price action is below the cloud and the bottom end cloud chart resistance remain in place! 298 is a major resistance zone to get past! Downside risk towards old cloud chart support zones on the weekly cloud chart!


Nasdaq Composite: Fighting hard to rebound from the top end cloud chart support zone!

Nasdaq Composite (.IXIC): Fighting hard to rebound from the top end cloud chart support zone! 

 IXIC fighting hard to rebound from the top end of the cloud chart support zone! Vital that the index stays above the 11441 support zone! If price trades below this level of the cloud the outlook on the daily cloud chart will change to bearish from bullish! 
 Recently the IXIC rebounded from the critical support zone of 11500, only to run into trouble when it hit older resistance zones between 12351 and 13110! The trade then reached profit taking zone at these old cloud chart resistance zones! Rebound swing trade potential from this cloud chart support zone!


Long-term price action still below the cloud and this remains bearish on the weekly cloud chart! Bottom end of the cloud remains key resistance zones that can test any bullish rally!

Thursday 1 September 2022

S&P500 Index Fighting hard for support at the top end of the cloud! Downside risk going up!

S&P500 Index Fighting hard for support at the top end of the cloud! Downside risk going up! Need to get a rebound from this cloud chart support zone. If support fails and the SPX closes and trades below the bottom end of the cloud outlook changes from bullish to bearish on the daily cloud chart!
Outlook remains bearish long-term on the weekly cloud chart since price action is below the cloud. There was a great swing trade rebound from old support levels back up to the bottom end of the cloud! Bottom end cloud chart resistance held and the market been selling off since hitting that zone!