NVDA: Up 154% since the artificial intelligence algorithm buy signal!
AI generated stop loss level is at 464!

NVDA: Up 154% since the artificial intelligence algorithm buy signal!
AI generated stop loss level is at 464!
Bubble stocks: Here are a few winners of the past! Was fun trading them at the time, but remember never get married to a share!
The old Taser, now that was a blast from the past! AAXN: TASR was up close to 10000% at one point!

More recently it was Tilray, Also all over CNBC at the time, nothing could stop it then,,,well where is it now? After the 700% plus rally its now back to square one!

UTSTARCOM another one that had a huge bubble, and then it all burst! It was all over CNBC as well during the time!


I have a fond memories of these bubbles, and when I traded these, and I always keep it in the back of my mind that TSLA and AAPL days will come! When the music stops, make sure you got your chair. But for now the bubble party is going strong!


All vertical elevators stop at the top and bottom floors!
NDX-100 Hit the 11400 P&F chart target! Next target 11600, but consolidation/reversal risks remain high at these elevated levels! Beware any P&F chart reversal to signal profit taking around these P&F chart targets!

S&P500: FOMOFED rally in full swing! SPX fighting old high resistance zone! Need a sustained breakout past this zone! Fail that we heading back down to top end of old cloud chart support zone of 3212!

NDX-100: Getting closer to 11400 P&F chart target! Beware any profit taking around P&F chart targets!

FOMOFED rally in full swing!
DJI: Dow Jones getting closer to key P&F chart targets: 28200/28400!

Beware profit taking around key targets! FOMOFED rally keeps going!
DJI: Dow Jones Index fighting resistance at the top end of the cloud! 28231 key resistance zone!
DJI needs to break past this 28231 top end cloud chart resistance zone on the weekly cloud chart. Fail that, then expect the bottom end of the cloud support zone to be tested at 27113!
Need the DJI to break past cloud chart resistance to change from a bear to a bull market on the weekly cloud chart.

Price action above the cloud is bullish, and price action below the cloud is bearish!
S&P500: Closed the gap, now getting closer to old high resistance zone: 3393.52!
FOMOFED liquidity bubble keeping the party going! S&P500 closed the gap, and is now close to the next key resistance zone of 3393.52! Need a breakout past that level for the rally to continue!
If resistance holds, we should see the market consolidate back down to top end cloud support zone of 3211!

All aboard, 3393.52 is the next stop, but a risky time for the market over the next few months!

Xetra Dax: Digging into the cloud after rebounding from bottom cloud support zone!

Downside risk remain high since price action is still below the top end of the cloud! Need to see a breakout above the top end cloud for the outlook to change from bearish to bullish!
FTSE-100 : Fighting resistance at the bottom end of the cloud 6087!

FTSE-100 rebounded from old cloud chart support zone at 5876. Its now trying to break past the 6087 resistance zone! If it manages this, then the next target is the top end of the cloud at 6210! If price action remains below the cloud that will keep the outlook as bearish! Critical week ahead!
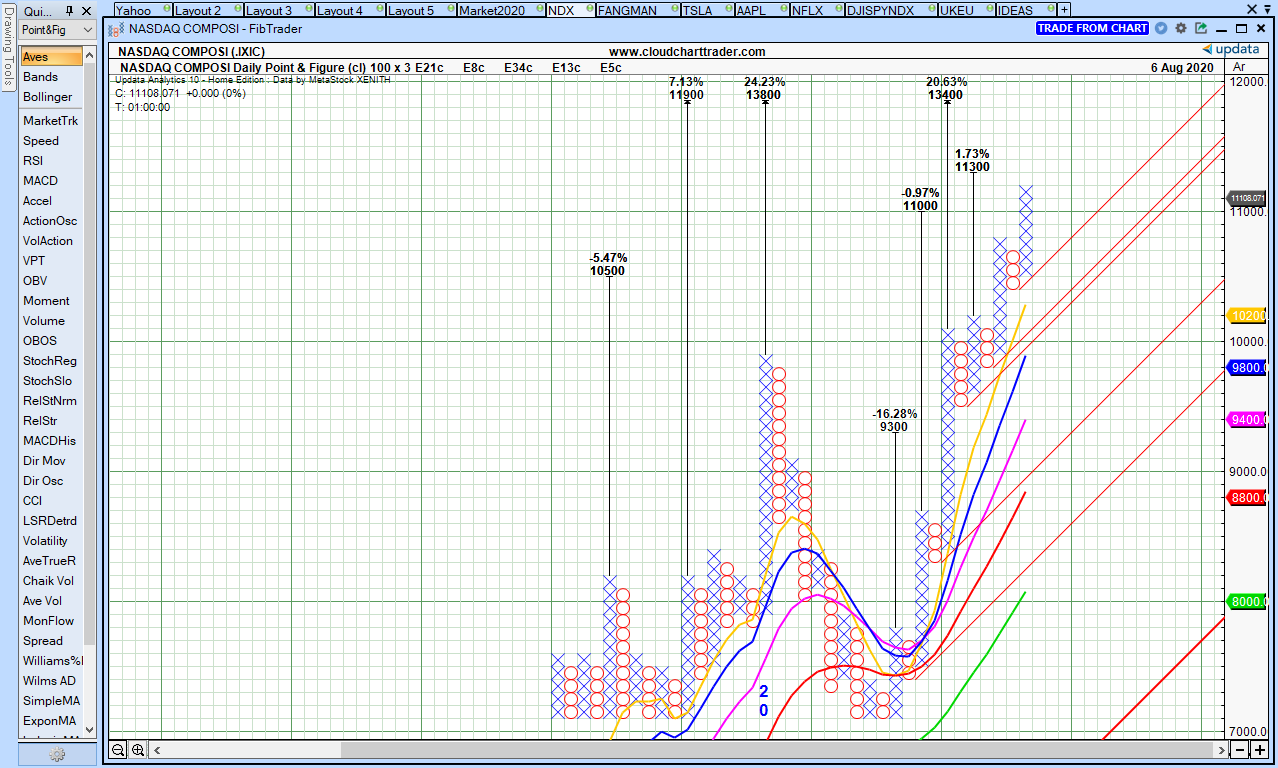
Nasdaq Comp: IXIC index hit the 11000 P&F chart target. Next target 11300, but beware P&F chart consolidation risk! FOMOFED liquidity rally racing ahead! Beware consolidation risk in extended market!