Friday 30 April 2021
Bitcoin: Getting close to rebound zone at bottom of cloud chart support zone!
Bitcoin: Getting close to rebound zone at bottom of cloud chart support zone!
BTC getting closer to the bottom end cloud chart support zone at 52383. Potential rebound if support holds in and around these levels. It is vital that Bitcoin keeps trading above this zone for then it still remains bullish from a cloud chart trading perspective. Any close and price action below the cloud will change the outlook the bearish.
So far so good, looking out for that rebound around cloud chart support levels. The upside target is close to the next resistance zone at the top end of the cloud chart: 58162/58955 zones.
Make or break day for Bitcoin!


Thursday 29 April 2021
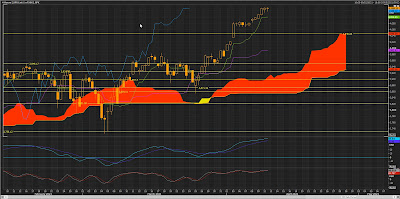
S&P500: Another up day in bubble land! Next P&F chart target 4275! Risky times!
S&P500: Another up day in bubble land! Next P&F chart target 4275!
S&P500 hitting up side targets! S&P well extended in this liquidity bubble rally! Next up side 4275/4295/4375! But beware any consolidation risk at these extended levels!
What a liquidity bubble we living in!
Go S&P500 go..


Wednesday 28 April 2021
Bitcoin BTCUSD: Fighting cloud chart resistance at top end of the cloud! Critical breakout zone!
Bitcoin BTCUSD: Fighting cloud chart resistance at top end of the cloud! Critical breakout zone!
Make or break week for BTC to breakout past top end cloud chart resistance! If resistance holds then we heading back down to bottom cloud chart support zone. If BTC breakout past top end cloud resistance then we heading back up to the 60000 zone!


Monday 26 April 2021
Bitcoin up 10%+ since the cloud chart support rebound trade!
Bitcoin up 10%+ since the cloud chart support rebound trade!
Next key resistance target is around the top end of the cloud at 54980/58150 resistance zones! BTC needs to trade above the top end of the cloud for outlook to be bullish on a cloud chart basis. We not out the digital woods yet!!!


Bitcoin: Rebounded after hitting 48500/47500 P&F chart targets! Next targets are 53750 and 54500!
Bitcoin: Rebounded after hitting 48500/47500 P&F chart targets!
After the major sell signals at 64000 on a point and figure chart basis, Bitcoin then hit 55000 and then 51500 and then 50250/48500 and then also the 47500 downside pointand figure chart targets!
A great little rebound took place and then the buy signal on a point and figture chart basis was around the 48000 zone. Bitcoin hit the 51750 target, and now the next two targets are 53750 and 54500 and these levels are at trend resistance. Lots of resistance zones to get past here on a P&F chart basis!


Friday 23 April 2021
Bitcoin: Fighting for support at bottom end of the cloud! Make or break day!
Bitcoin: Fighting for support at bottom end of the cloud! Make or break day!
Bitcoin fighting for support at the bottom end of the cloud! If support does not come in at these levels, and price trades below the cloud level then the outlook changes from bullish to bearish in the daily chart.
Critical day ahead!


Wednesday 21 April 2021
Tuesday 20 April 2021
Thursday 15 April 2021
S&P500 Index: On its way to next P&F chart target of 4180. The liquidity bubble keeps going and going!
S&P500: On its way to next P&F chart target of 4180. the liquidity bubble keeps going and going!
S&P500 not far from the next P&F chart target of 4180! Consolidation risk high at these elevated levels. This rally comes after hitting the 4075/4100 point and figure chart targets!
The FOMO FED liquidity bubble keeps going and going and going! Powell Power!


Wednesday 14 April 2021
BTCUSD: Bitcoin hit the 64000 point and figure chart target! Next targets 70250/74000!
BTCUSD: Bitcoin hit the 64000 target! Next targets 70250/74000!
Bitcoin hit a few targets as identified earlier. The 63250, 63750 and then the 64000 point and figure chart targets were all met!
Next targets are 70250 and 74000 but beware we can see a consolidation along the way to the next targets. BTC ATR level is $2770, meaning at any time price can swing with a +/-3000 range! Thats the volatility! Any trainling stop loss should accomodate the vol.


Tuesday 13 April 2021
Bitcoin BTCUSD: Make or break week as BTC can breakout to next P&F chart targets of 64000!
Bitcoin BTCUSD: Make or break week as BTC can breakout to next P&F chart targets of 62750/63250/64000 and if the rally lasts the 70250 P&F chart target!


SP500 Index extended from cloud support! Consolidation risk remain high here!
SP500 Index extended from cloud support! Consolidation risk remain high here!
 Quite possible for the market to correct back down to the top end of the front end of the cloud at 4046!

S&P500 testing upper end of the channel, consolidation risk high here!
S&P500 testing upper end of the channel, consolidation risk high here!


Friday 9 April 2021
Tuesday 6 April 2021
SPX: S&P500 index met the 4075 P&F chart target!
SPX: S&P500 index hit the 4025, then 4050 then 4075 targets! Next targets are
4325, but not without increased consolation risk where we are now. Beware
reversals and consolidations in and around point and figure chart targets.

 On the 5X3 P&F chart the SPX also hit targets of 4050/4060/4075, and the next
one on this chart is the 4100 target.
On the 5X3 P&F chart the SPX also hit targets of 4050/4060/4075, and the next
one on this chart is the 4100 target.


Monday 5 April 2021
SPX S&P500 very close to hitting the 4025 P&F chart target!
SPX S&P500 very close to hitting the 4025 P&F chart target of 4025, and then the next target is 4075, but beware any P&F chart reversal or consolidation risk close to targets.


Subscribe to:
Posts (Atom)