
Monday 31 July 2017
Crude Oil Full0917 Future -Fighting resistance at bottom end of the cloud!
Crude Oil Full0917 Future -Fighting resistance at bottom end of the cloud! Critical resistance zone!

S&P500 Index: consolidation risk to old highs remain!
S&P500 Index -Slow grind higher, with consolidation risk to test old highs/breakout resistance zone for support!


Dow Jones 30 index: Slow grind higher!
DJ30 Industrial Avg Index -Slow grind higher, but consolidation risk towards old highs to test for support remain! Dow Chart


DAX30 Index-Remain in a confirmed downtrend!
DAX30 Index-Remain in a confirmed downtrend since losing support at bottom end of the cloud! Downside risk remain!


Bottom end of the cloud is a key resistance zone! Old lows next key support levels!
FTSE100 Index -fighting for support at bottom end cloud
FTSE100 Index -Critical week, fighting for support at bottom end cloud chart support zone!


FTSE All-Share fighting for support at bottom end of cloud!
FTSE ALL-SHARE-Range bound, with bottom of cloud as support zone/top end cloud resistance zone! Testing support! FTSE All Share Chart
 Fighting for support at bottom end of cloud chart support zone!

Friday 28 July 2017
STOXX600-EU markets have rolled over!
STOXX600-EU markets have rolled over with price action taking place below cloud, suggesting a downtrend is in place. The bottom of the cloud is a key resistance zone!


DJ30 Industrial Avg Index -Slow grind higher.
DJ30 Industrial Avg Index -Slow grind higher, with increased consolidation risk! Top end of cloud major support zone!


Nasdaq 100 nasty reversal & consolidation risk high!
NASDAQ100 Index -Nasty consolidation after the breakout! Top end of cloud is key support zone!


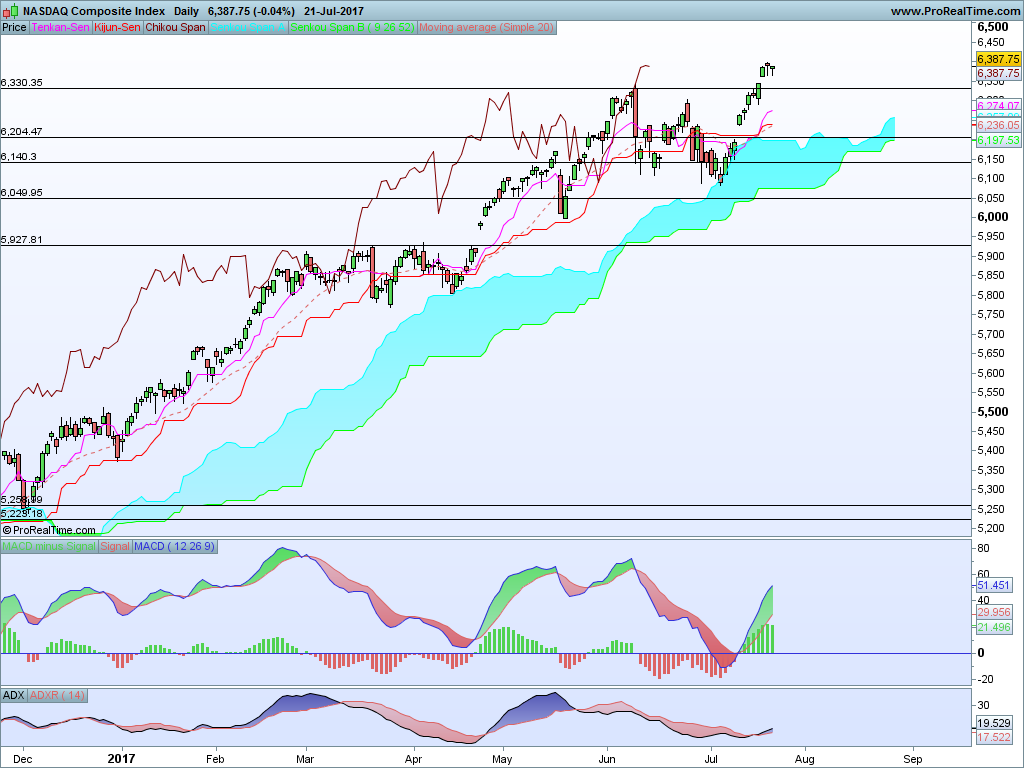
Nasdaq Composite ripe for consolidation.
NASDAQ Composite Index -Nasty price action yesterday, consolidation risk remain high at these key levels!


Wednesday 26 July 2017
EUR/USD -Fighting old cloud chart resistance levels of 1.1674
EUR/USD -Fighting old cloud chart resistance levels of 1.1674 resistance zone! Consolidation risks remain! Euro Chart


Tuesday 25 July 2017
Gold Full0817 Future -Running into resistance!
Gold Full0817 Future -Running into resistance at bottom end cloud chart resistance zone! Gold chart
Need to see a breakout past this resistance zone, if not, then it can reverse lower if resistance holds.

Need to see a breakout past this resistance zone, if not, then it can reverse lower if resistance holds.

FTSE 100 index: Closer to key support zone!
FTSE 100 index on its way to test for support at bottom end of the cloud! Potential rebound zone if support holds at these levels!
Downside risk remain high here!

Downside risk remain high here!

DAX30 index in trouble!
DAX30 Perf Index -In trouble, as price action taking place below cloud! Next key support zone: 11980! Dax chart


Monday 24 July 2017
S&P500 Index -Need to see a follow-through here.
S&P500 Index -Need to see a follow-through here after the breakout. Old highs key support zone!
Chart: S&P500 Chart
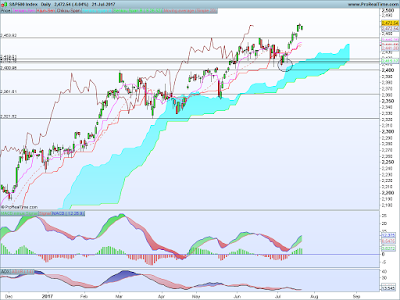
Chart: S&P500 Chart

Expect old highs to be tested for new support! Front cloud indicate key support levels!
Trend is looking good here, with the top end of the cloud so far the major support zone!
NASDAQ100 Index -Need to see a follow-through of this new high.
NASDAQ100 Index -Need to see a follow-through of this new high, old highs to be tested for support! NDX Chart


Top end of the cloud remain a key support zone where the market keeps rebounding from. Now need to see a follow-through of this new high, and also need to see support hold at old highs! Critical week!
NASDAQ Composite Index-Strong rebound from cloud chart support.
NASDAQ Composite Index-Strong rebound from cloud chart support zone at top of cloud.Old highs next key support zone! Comp Chart:
Need to test these old highs, but top end of cloud remain key support zone in current trend.

Need to test these old highs, but top end of cloud remain key support zone in current trend.
Monday 10 July 2017
STOXX600-EU markets in a downtrend!
STOXX600-EU markets in a downtrend as price action is taking place below the cloud! Cloud new resistance zone! Next support target: 376!
STOXX600 Chart

STOXX600 Chart

NASDAQ100 Index -Rebounded from cloud support at bottom of cloud!
NASDAQ100 Index -Rebounded from cloud support at bottom of cloud! Next resistance top end cloud level! NDX Chart


FTSE100 Index-Fighting for support!
FTSE100 Index-Fighting for support at bottom end cloud chart support zone! Rebound potential IF support holds!


DAX30: Fighting for support at bottom cloud level!
DAX30 Perf Index-Critical week, fighting for support at bottom end cloud chart support zone! If support holds at this level, we can see a rebound back up to the top end of the cloud! If price moves below the cloud, that would indicate a new trend change, from up to down! Critical week!


Friday 7 July 2017
NASDAQ100 Index -Fighting for support at bottom end cloud.
NASDAQ100 Index -Fighting for support at bottom end cloud chart support zone! Critical level!
If support comes in here, we could see a short term rebound.
If support fails, then overall trend will be changing, as price action will then be below the cloud, and that is negative.
NDX Chart

If support comes in here, we could see a short term rebound.
If support fails, then overall trend will be changing, as price action will then be below the cloud, and that is negative.
NDX Chart

Thursday 6 July 2017
Europe Stoxx600 in deep trouble!
Europe Stoxx600 in deep trouble, as price action is taking place below the cloud! Front cloud also confirms a trend change since the cloud Span A line is now below cloud Span B line, with indicate that the trend is potentially changing to a down trend.
Outlook remain bearish since the MACD and Cloud Chart sell signal above the cloud!
Both the bottom level and top level of the cloud, (Cloud Span A & B) are now new resistance zones!

Outlook remain bearish since the MACD and Cloud Chart sell signal above the cloud!
Both the bottom level and top level of the cloud, (Cloud Span A & B) are now new resistance zones!

Chart Link: Stoxx600
S&P500 Index -Slow grind sideways.
S&P500 Index -Slow grind sideways, with front cloud levels as key support zone!
S&P500 Chart
 Front cloud support levels to watch are 2419/2415. Potential rebound zone!
S&P500 Chart

Tuesday 4 July 2017
EUR/USD -Cloud chart resistance held
EUR/USD -Cloud chart resistance and old high resistance levels remained in place! Consolidation underway. EURUSD


DAX rebounded from cloud chart support zone!
DAX30 Perf Index -Rebounded from bottom cloud chart support zone:12342. Critical week to see if rebound will last! DAX
 Upside potential is back up to bottom of cloud at the top resistance zone!

TQQQ fighting for support at cloud chart support zone!
PROSHARES ULTRAPRO QQQ -Fighting for support at bottom end cloud chart support zone! Potential rebound zone! TQQQ Chart: TQQQ


NASDAQ100 Index -Getting closer to key cloud chart support zone.
NASDAQ100 Index -Getting closer to key cloud chart support zone at bottom end of cloud! Potential rebound zone! NDX Chart


I am on the lookout for a potential rebound at the bottom end of the cloud. If support fails, we heading down, but there is the potential for a short term rebound at cloud chart support zone!
FTSE100 Index -Rebounded from cloud support!
FTSE100 Index -Rebounded from cloud support, Critical for a follow-through. cloud support level: 7320! Chart link:FTSE100


Monday 3 July 2017
DJ30 Industrial Avg Index -Downside risk towards the top end cloud chart
DJ30 Industrial Avg Index -Downside risk towards the top end cloud chart support zone this week.
Its at this critical top end cloud chart level where one can see a rebound if support holds at these levels.
Dow 30 Chart:

Its at this critical top end cloud chart level where one can see a rebound if support holds at these levels.
Dow 30 Chart:

NASDAQ100 Index -On its way to test support at key cloud chart level!
NASDAQ100 Index -On its way to test support at 5625/5593. Key cloud levels to watch for a rebound. NDX Chart


NASDAQ Composite Index -Downside risk towards top end of cloud!
NASDAQ Composite Index -Downside risk towards the top end of the cloud, next key support zone!
Nasdaq Chart

Nasdaq Chart

Key levels to watch are 6106/6074. Looking out for a rebound at cloud chart support zones!
DAX30 Perf Index -Fighting for support.
DAX30 Perf Index -Fighting for support at a critical cloud chart level! If support fails, more downside risk! DAX Chart
Upside potential is a short term rebound from this cloud chart level.

Upside potential is a short term rebound from this cloud chart level.

FTSE 100: Fighting for support at bottom level of cloud!
FTSE100 Index -Critical week, looking for support at bottom end of the cloud! Key level of support being tested! FTSE Chart

If support fails at bottom end of cloud, more downside to come.
Upside potential is a rebound from bottom cloud support zone if support holds.

Upside potential is a rebound from bottom cloud support zone if support holds.
Sunday 2 July 2017
GBP/AUD -Rebounded from support.
GBP/AUD -Rebounded from support at bottom end of cloud. Next key resistance top end of front cloud level:1.7084.
GBPAUD Chart
GBPAUD Chart
AUDUSD Weekly outlook: Close to key resistance!
AUDUSD getting closer to key old high resistance levels around 0.7746. Slow grind higher since the cloud chart trade signal, and now close to profit taking zones. Will be on the lookout for a reversal/weakness as AUD is getting closer to these key resistance zones!
Overall cloud chart outlook remains bullish.

Overall cloud chart outlook remains bullish.

Subscribe to:
Posts (Atom)