Thursday 23 February 2023
Tuesday 14 February 2023
ACLS: Axcelis Tech up 150% since the Artificial Intelligence buy signal! Winning with AI!
ACLS: Axcelis Tech up 150% since the Artificial Intelligence buy signal! The "Major Reversal" AI strategy is a great AI strategy to trade! Winning with AI! Trailing stop will lock in profits on the way up!
TSLA: Rebound rally ran into trouble at the front end of monthly 212 Cloud Chart resistance zone! Reversal risk high if resistance holds!
TSLA: Rebound rally ran into trouble at the front end of monthly 212 Cloud Chart (CC) resistance zone! Reversal risk high if resistance holds!
On the weekly CC the TL of 207 as well as old CC resistance line of 213 seems to be another major resistance level! The rebound rally from the support zone of 109 now running into trouble at these two CC resistance zones! Consolidation risk down to the front end 179 CC support zone as well as the 157 SL of the CC if resistance holds!
Upside potential if we get a sustained breakout past the 214 resistance zone is the bottom end of the CC level at 243!
AAPL: Apple's rebound rally running into resistance at the top end of the weekly Cloud Chart resistance zone!
AAPL: Apple's rebound rally running into resistance at the top end of the weekly Cloud Chart (CC) resistance zone!
Consolidation risk remain high here at 156 if resistance holds. Downside risk towards the 144 front end cloud chart support zone, and 140 the TL of the CC.
A sustained high volume breakout past the top end Cloud Chart resistance zone will change the CC outlook to bullish from bearish. Price action needs to be above the top end CC resistance zone for the outlook to change to bullish on the CC.
Consolidation risk remain high at these levels!
Thursday 9 February 2023
Wednesday 8 February 2023
S&P500 EMini Futures: AI generated Volatility & Swing trades reached the profit target resistance zones! AI now watching for the next trade!
S&P500 EMini Futures: AI generated Volatility & Swing trades reached the profit target resistance zones! AI now watching for the next trade! Winning with AI!
https://www.metastock.com/alphaharvestf
BP.L BP oil up more than 82% since the Cloud Chart buy signal! Making money by causing pollution! BP: "Big Pollution!"
BP.L BP oil up more than 82% since the Cloud Chart buy signal! Making money by causing pollution! BP: "Big Pollution!"
Investors making free money since the environment pays the price!
Xetra Dax Index: Rebound rally running into old Cloud Chart resistance zones: 15476/15616! Consolidation risk if resistance holds!
Xetra Dax Index: Rebound rally running into old Cloud Chart resistance zones: 15476/15616! Consolidation risk if resistance holds! A breakout past this zone could lead to a rally up to 16285!
Downside risk for Q1 and Q2 is the top end of the front end of the Cloud at zones: 14290/14077.
Tuesday 7 February 2023
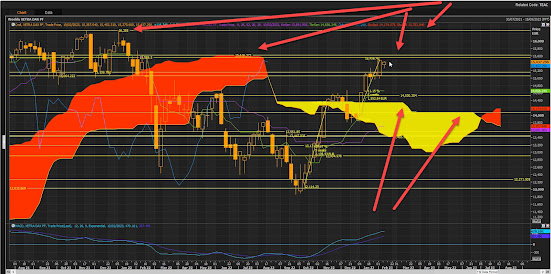
Nasdaq Composite Index: Rebound rally running into significant Cloud Chart resistance zone: 12320/12381! Consolidation risk down to 11634/11238!
Nasdaq Composite Index: Rebound rally running into significant Cloud Chart resistance zone: 12320/12381 at the bottom end of the Cloud! ! Consolidation risk down to 11634/11238 if resistance holds at Cloud Chart zones! Need to see a significant high volume driven breakout past these levels! If not then seasonal weakness towards a March low!
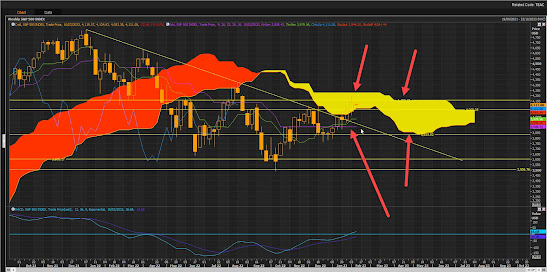
S&P500 Index: Rebound rally running into resistance zones of 4157/4220 zones! Consolidation risk high here towards 4068/3979/3908 & 3835 if resistance holds!
S&P500 Index: Rebound rally running into resistance zones of 4157/4220 zones! Consolidation risk high here towards 4068/3979/3908 & 3835 if resistance holds! Really need to see a sustained breakout past 4220 Cloud Chart resistance zone for the CC to change to bullish from bearish. Price action below the Cloud remains bearish. Risky times ahead!
TSLA: Rebound rally now digging into old Cloud Chart resistance zones: 195/204/208! Consolidation risk remain high!
TSLA: Rebound rally now digging into old Cloud Chart (CC) resistance zones: 195/204 and the TL of the CC at 208! Consolidation risk remain high! So far it has been a great rebound rally from the support zone range of between 96/115, with the resistance zones as the upside profit targets for the swing trades.
Thursday 2 February 2023
Nasdaq EMini Futures: January AI generated trades up by +2300 points! Winning with AI!
Nasdaq EMini Futures: January AI generated trades up by +2300 points! Winning with AI!
Two Volatility Artificial Intelligence AI generated trades up by +1000 and +1300 respectively for January. Great start for the year. Moving into profit taking zones now after strong rally.
META: The old FACEBOOK, King of the Digital Social Sewers, up by more than 75% since the AI buy signal! Now moving into profit taking resistance zone at the 89 EMAVG!
META: The old FACEBOOK, King of the Digital Social Sewers, up by more than 75% since the Artificial Intelligence (AI ) volatility trade buy signal! So far so good winning with AI!
Wednesday 1 February 2023
S&P500 Index : Cloud Chart rebound rally now running into major Cloud Chart resistance at the 4068/4157 zones!
S&P500 Index : Cloud Chart rebound rally now running into major Cloud Chart resistance at the 4068/4157 zones! Need to see a sustained breakout past the top end of the Cloud level of 4157 for the outlook to change to bullish on the weekly Cloud Chart. Downside risk if resistance holds back down to 3932 the TL of the CC, 3908 the STD line of the CC, and then the bottom end CC support zone at 3835!
The rally is not out the woods yet and there is February seasonal downside risk to keep in mind! Need to see that breakout!
Xetra Dax Index: Cloud Chart rebound rally now running into a major resistance zone between 15064/15159/15559! Consolidation risk in February!
Xetra Dax Index: Cloud Chart rebound rally now running into a major resistance zone between 15064/15159/15559! Consolidation risk in February!
Expect a reversal if resistance holds back down to the front end Cloud Chart support zones of 14530/14338 & 14068! February seasonal consolidation risk remain in place!
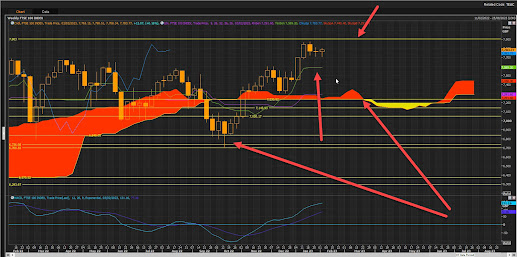
FTSE 100 Index: Cloud Chart Rebound rally up by +1000 points, now at risk of consolidating towards 7589/7291 & 7236!
FTSE 100 Index: Cloud Chart (CC) Rebound rally up by more than +1000 points, now at risk of consolidating towards 7589/7291 & 7236!
The Q4 and January rally in the FTSE100 index is now getting closer to a major resistance level of 7903 zone" There is downside consolidation risk back down to the 7589 TL of the CC, as well as 7291 the STD line and the front end CC support zone at 7236 if this resistance level holds at 7903!
Expect February seasonal weakness to drive part of the downside consolidation! But so far it been a great few with a CC swing trade.


