
Wednesday 29 June 2022
WTI Light Crude up more than 10% since the AI buy signal! Winning with AI!
WTI Light Crude up more than 10% over the last 5 trading days since the artificial intelligence (AI) buy signal on the 4 hour chart! This comes soon after WTI dropped more than 12% after the sell signal, and the AI generated a good return going short! Winning with AI!
 https://www.metastock.com/alphaharvest3for1
Tuesday 28 June 2022
Monday 27 June 2022
Coinbase (COIN) Down more than 80% since the cloud chart sell signal! COIN made a great short!
Coinbase (COIN) Down more than 80% since the cloud chart sell signal! COIN made a great short!
There were two major sell signals, the cloud chart sell signal above the cloud and then the second sell when Coinbase lost support at the bottom end of the cloud and failed to regain support at that level. Price then confirmed that Coinbase went into a confirmed bear market!
 https://www.metastock.com/alphaharvest3for1

S&P500 Futures up more than 230 points since the AI buy signal!
S&P500 Futures up more than 230 points (+6.2%) since the artificial intelligence AI buy signal! The marjor market reversal signal is on average 94% accurate trading the S&P500 futures with a return of 16.5% on average per trade.
 https://www.metastock.com/alphaharvest3for1

Nasdaq Futures NQcv1 up 829 points since the AI buy signal! Winning with AI!

TSLA up 14% since the AI swing trade buy signal! Winning with AI!

TSLA: Rebounded from a cluster of cloud chart support levels at 640 on the weekly & monthly cloud chart! So far so good!
TSLA: Rebounded from a cluster of cloud chart support levels on the weekly cloud chart! So far so good!
TSLA rebounded from a key cloud chart support zone of 640! Upside resistance is at the bottom end of the cloud at 891 on the weekly cloud chart.
 TSLA rebounded from the 640 front cloud chart support zone on the monthly cloud chart! 812 is the next key resistance zone on this cloud chart.
 On the daily cloud chart the bottom end of the cloud as well as the top end of the cloud are the next resistance zones to be tested.


Nasdaq Composite: Rebounded from key cloud chart support zones! Next key resistance zone bottom end of the front cloud chart zone!
Nasdaq Composite: Rebounded from key cloud chart support zones! Next key resistance zone bottom end of the front cloud chart zone!
Nasdaq Composite rebounded from a cluster of cloud chart support zones on both the Monthly and Quarterly cloud chart! So far so good!

 On the weekly cloud support at the 10597 low held and the index managed to rebound from these levels, and this level was close to a major support zone of 10409 on the cloud!
 On the daily cloud there is upside resistance at the bottom end of the cloud as well as top end cloud chart resistance. Need to see a real strong breakout past these cloud chart resistance zones for the outlook to be bullish on the daily cloud!


S&P500 Great Cloud Chart Rebound Rally with Bottom of Cloud Next Key Resistance Zone!
S&P500 Great Cloud Chart Rebound Rally with Bottom of Cloud Next Key Resistance Zone!
S&P500 index rebounded from the old support zones between 3630/3723, with next key resistance zone to break past at bottom end of the 4 hour cloud chart levels of 3908 and then 4058! Really need to see a breakout past top end cloud chart resistance to change the outlook from bearish to bullish on the 4 hour cloud chart!


Thursday 23 June 2022
GBPUSD: Fighting hard for support at the bottom end of the 4 hour cloud chart!
GBPUSD: Fighting hard for support at the bottom end of the 4 hour cloud chart! Rebound potential if support holds, if not then outlook changes to bearish on the 4 hour cloud chart as soon as price action stays below the cloud!
 Outlook remains bearish on the daily cloud chart since price action is below the cloud. The bottom end of the cloud is a major resistance zone!


Light Crude Oil consolidating after hitting upside P&F chart targets of 122/126! Testing P&F trend line support zone now!
Light Crude Oil consolidating after hitting upside P&F chart targets of 122/126! Testing P&F trend line support zone now! Potential rebound zone if support holds!
Long-term targets are still at 134/142 but these targets still needs to be activated. Downside risk towards 104, and 102!


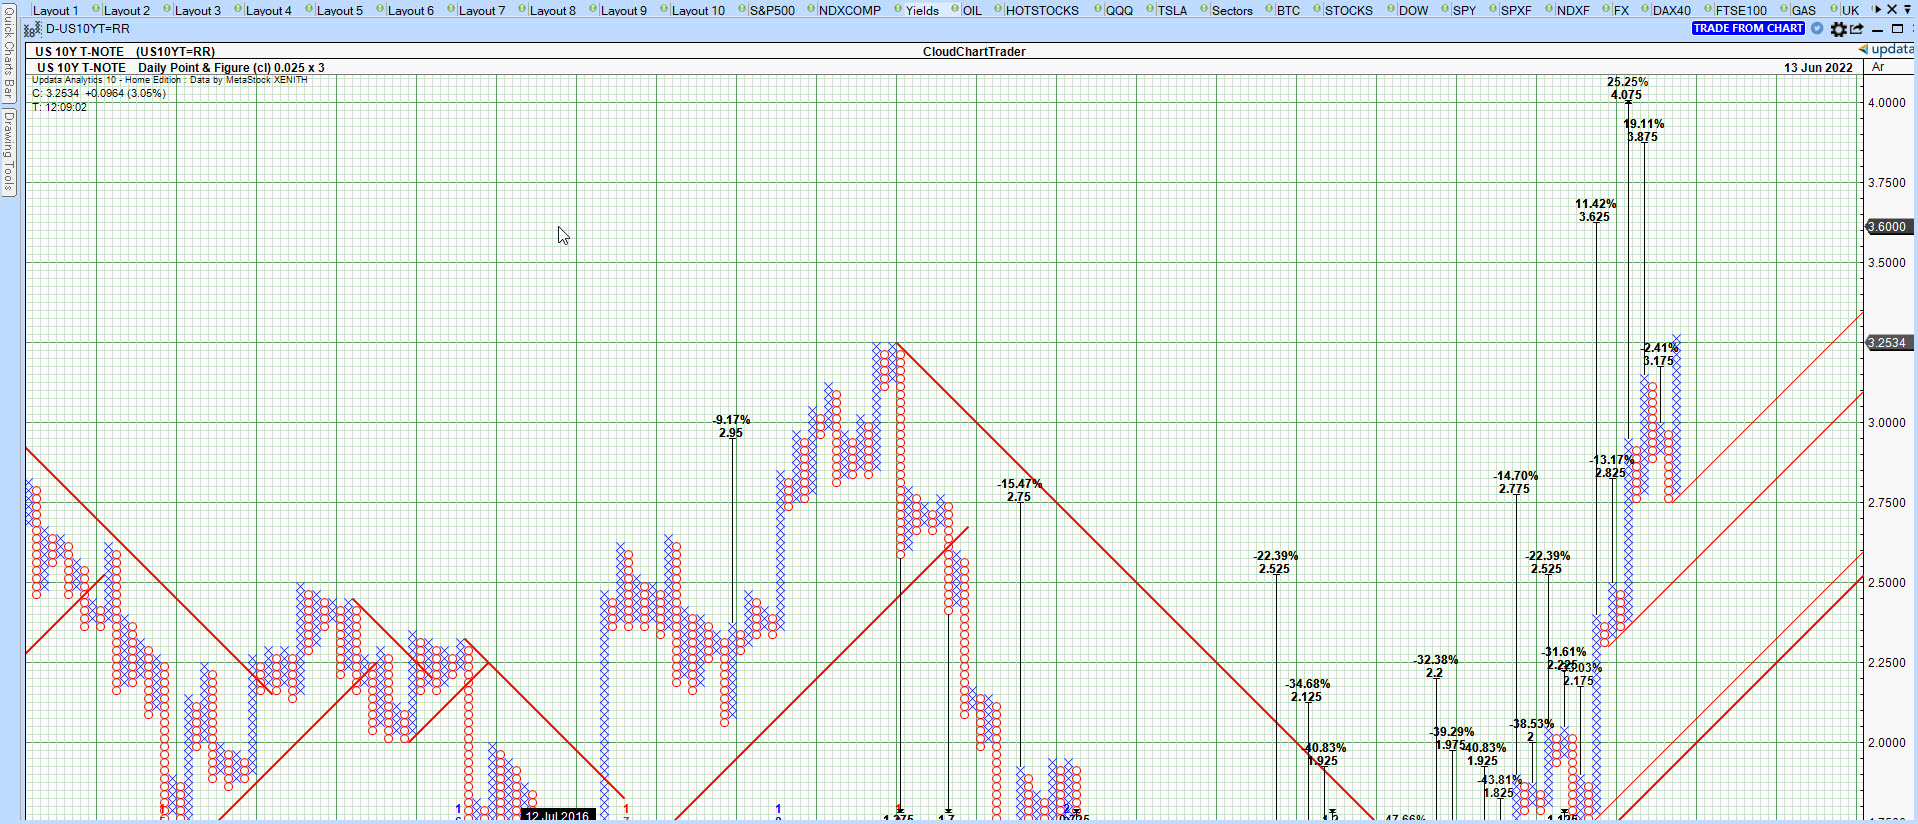
US 10Y T-Note Hitting P&F targets of 3.175/3.475! Next target 3.625 and then 3.875 and a big party at 4.075!
US 10Y T-Note Hitting P&F targets of 3.175/3.475! Next target 3.625 and then 3.875 and a big party at 4.075 and 4.2!
Expect consolidations along the way but the P&F chart trend is up for now!


META: King of the social sewer (FACEBOOK) Down more than 56% since the Cloud Chart sell signal! What a great short!
META: FB Down more than 56% since the Cloud Chart sell signal! What a great short! Beware the trick is always in a name, for example "Zuckerberg!"


Tuesday 21 June 2022
GBPUSD: Down more than 1900 points since the Cloud Chart sell signal!
GBPUSD: Down more than 1900 points since the Cloud Chart sell signal! GBPUSD managed to find support at the lows of 1.1957 and rebounded from that zone!
Two short trades the primary sell on the weekly cloud generated more than 1700 points and the secondry cloud chart cross sell signal generated more than 1400 points!
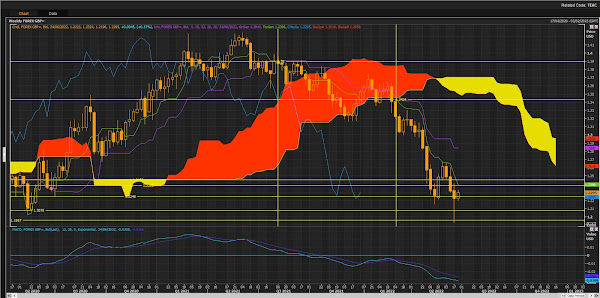 GBPUSD now on its way to test cloud chart resistance at the bottom end of the cloud.
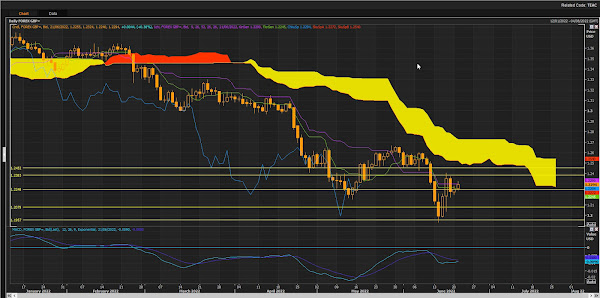 GBPUSD broke past the 1.2266 resistance level, and is now back above the top end of the cloud. Price action above the cloud is bullish, and any price action below the cloud is bearish.
Bullish on 4 hour, still bearish on daily and weekly cloud with bottom end cloud chart levels as the key resistance zones on the daily and weekly.
GBPUSD broke past the 1.2266 resistance level, and is now back above the top end of the cloud. Price action above the cloud is bullish, and any price action below the cloud is bearish.
Bullish on 4 hour, still bearish on daily and weekly cloud with bottom end cloud chart levels as the key resistance zones on the daily and weekly.


Nasdaq Composite: Fighting hard to rebound from old support zones 10597/10907.
Nasdaq Composite: Fighting hard to rebound from old support zones 10597/10907. These levels are not far from a major cloud chart support zone of 10409!
 Looking at the daily cloud chart, if support holds at these weekly cloud chart levels then there is upside potential to the bottom end resistance zone at the front end of the cloud. First level 11415 then the bottom end of the cloud at 11818/11951 and 12017! Price action needs to be back above the cloud to be bullish!


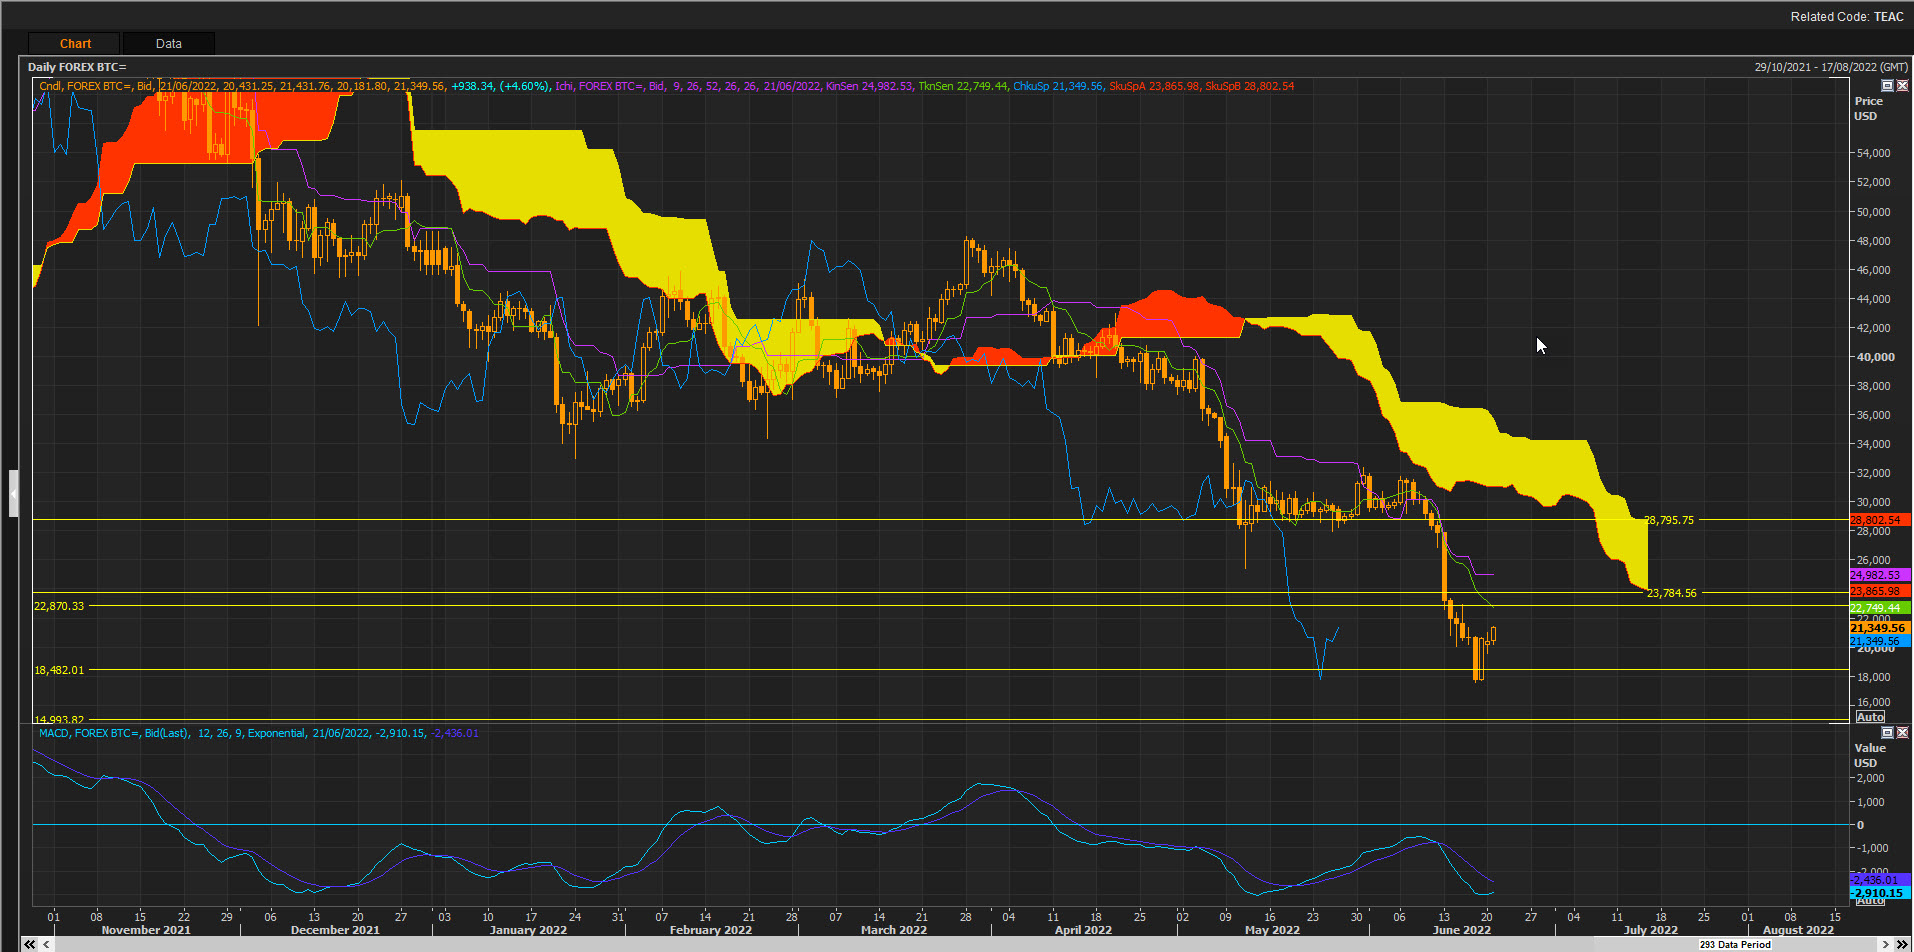
BTCUSD Bitcoin fighting hard for a rebound from key cloud chart support zone 18482!
BTCUSD Bitcoin fighting hard for a rebound from key cloud chart support zone 18482!
BTC reached the downside support target of 18482! Now testing this zone for potential support. It is just below the 22870 cloud chart support zone that did not hold. Weekly cloud chart remains bearish since price action is below the cloud, but short-term swing trades possible from key support zones! Dollar strength keeping BTC under pressure!
 Looking at the daily cloud chart so far the support zone of 18482 is holding with upside potential to the 22870 zone and then resistance at the front end of the cloud chart of 23784 and then 28795 zones.


Thursday 16 June 2022
Wednesday 15 June 2022
TSLA On its way to fight for support at the 640/597 front cloud chart support zones!
TSLA Down more than 40% since the Cloud Chart sell signal! TSLA On its way to fight for support at the 640, front end bottom cloud chart support zone on the monthly cloud chart. If support fails to hold then the next key cloud chart level is 597 and 468 on the monthly cloud.
 On the weekly cloud chart there is a cluster of support around the 640 , 615 597 and 587 cloud chart support zones! Potential rebound zones if support holds.
Price action remains bearish on the weekly cloud chart since price action is below the cloud!
On the weekly cloud chart there is a cluster of support around the 640 , 615 597 and 587 cloud chart support zones! Potential rebound zones if support holds.
Price action remains bearish on the weekly cloud chart since price action is below the cloud!


Bitcoin BTCUSD Down more than 50% since the cloud chart sell signal! On its way to test 18482/14993 & 11899 support zones!
Bitcoin BTCUSD Down more than 50% since the cloud chart sell signal! On its way to test 18482/14993 and 11899 support zones! BTC trading below the cloud weekly cloud chart levels and that remains bearish! Rebound potential at key cloud chart support zones!


Monday 13 June 2022
S&P500 : Hitting downside P&F chart targets 3870/3795 as the great conspicuous consumption bubble deflates!
S&P500 : Hitting downside P&F chart targets 3870/3795 as the great conspicuous consumption bubble deflates!
Downside risk to 3750/3675 and a risky level of 3585/3555! Looking out for a P&F chart reversal to signal the end of the trend!


Bitcoin Bear Market Rally: Hitting downside P&F chart targets of 26000/23750!
Bitcoin Bear Market Rally: Hitting downside P&F chart targets of 26000/23750! This comes soon after hitting the 32750 and 32250 targets!
Looking out for a P&F chart reversal to signal the end of the current trend and a potential rebound!
BTC is down more than 40% since the P&F chart sell signal!


TSLA: Still battling bearish outlook since price action is below the cloud! TSLA down more than 35% since the sell signal!
TSLA: Still battling bearish outlook since price action is below the cloud! TSLA down more than 35% since the sell signal!
TSLA downside risk towards old cloud chart support zones of 692/662 and 649! Rebound potential if support holds at these levels. Front cloud resistance is at 747!


FTSE100: Fighting for support at the bottom end of a key cloud chart support zone! Make or break time here!
FTSE100: Fighting for support at the bottom end of a key cloud chart support zone! Make or break time here! Price action below the cloud is bearish and FTSE100 needs to rebound here or the outlook on the daily will remain bearish! Testing support at 7192 with downside risk to next support zone of 7144!
 On the weekly cloud there is downside risk towards the top end of the weekly cloud at 7158/7144!


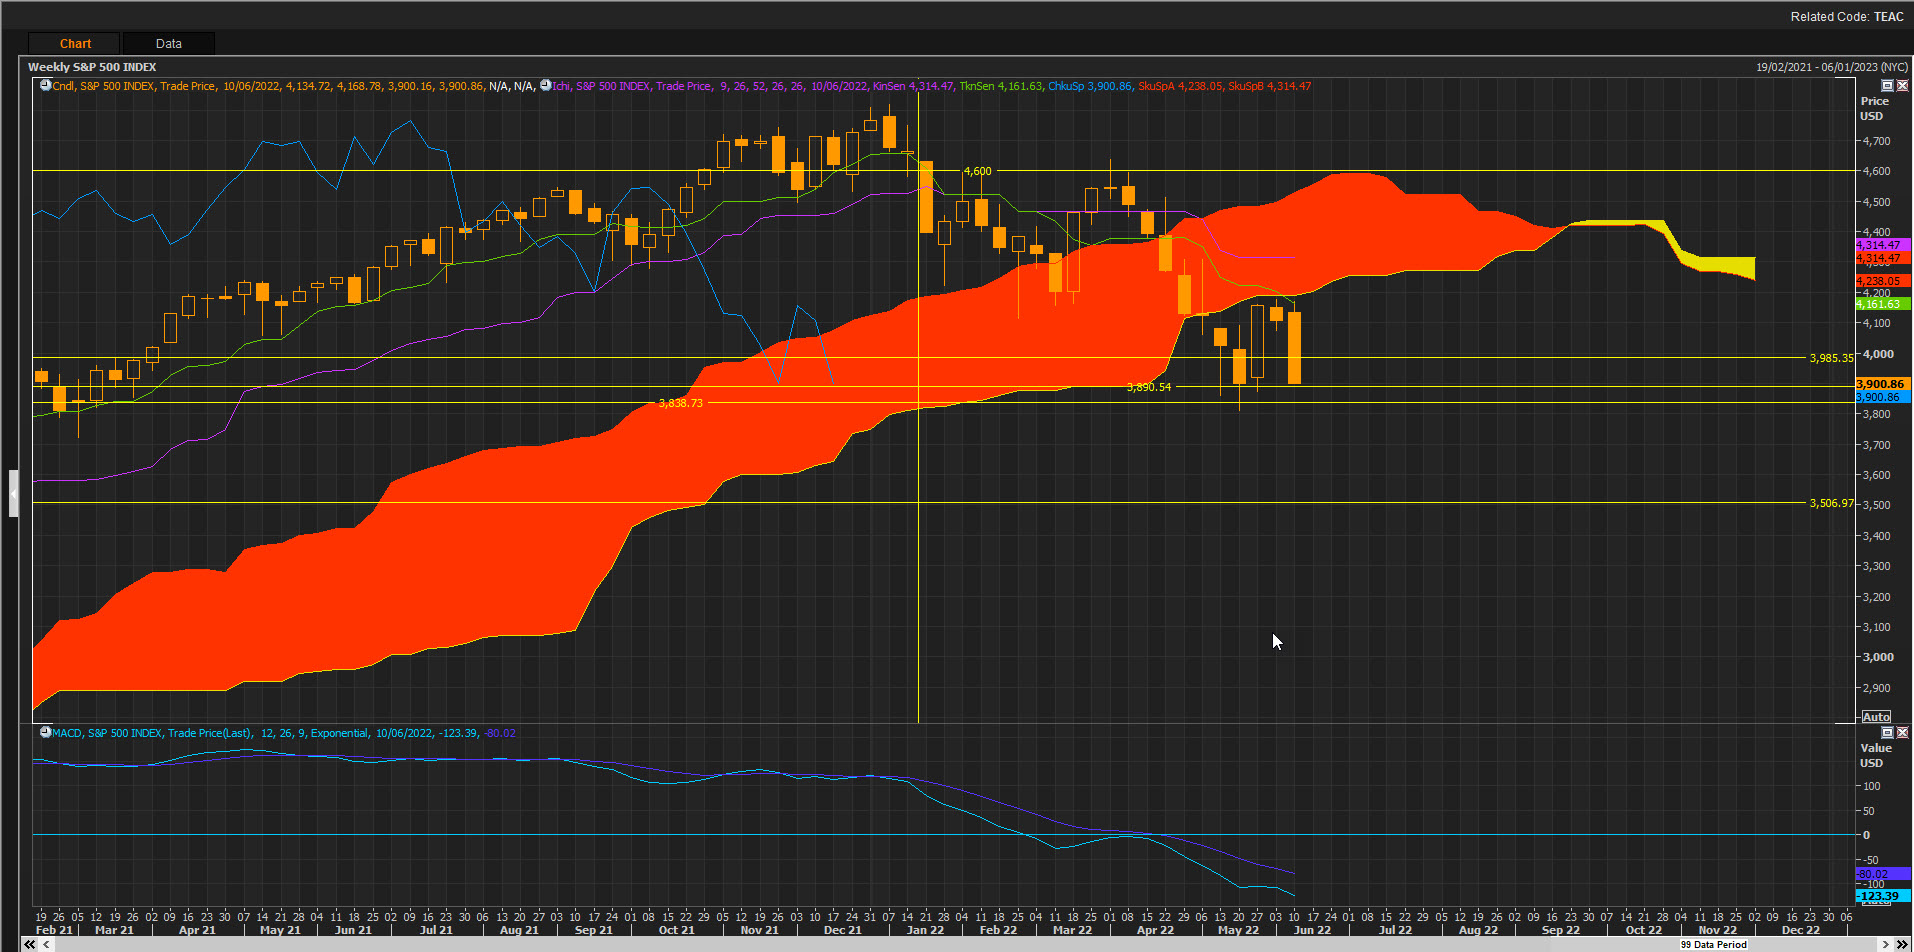
S&P500 Index Still stuck in bear market as price action below the cloud!
S&P500 Index Still stuck in bear market as price action below the cloud!
 In its way to test old cloud chart support zones of 3890/3838 to 3792 zones! Rebound potential but price action remains below the cloud and that is bearish!
The long-term sell signal was at 4600!
In its way to test old cloud chart support zones of 3890/3838 to 3792 zones! Rebound potential but price action remains below the cloud and that is bearish!
The long-term sell signal was at 4600!


US 10Y T-Note Hitting P&F targets of 3.175, with next target 3.625 and then 3.875!
US 10Y T-Note Hitting P&F targets of 3.175, with next target 3.625 and then 3.875!
This comes soon after hitting 2.775 and 2.825 targets recently!

BTC Bitcoin down more than 40% since the cloud chart sell signal!
BTC Bitcoin down more than 40% since the cloud chart sell signal! Price action below the cloud remains bearish!
It lost support at a key support zone of 28780!
 Heading to next key cloud chart support zone of 22975! Potential rebound zone if support holds at that level, but price action is still below the cloud and that is bearish long-term.


Subscribe to:
Posts (Atom)