Thursday, 28 July 2022

Carvana (CVNA.K) Used car sales Carvana down more than 90% since the cloud chart sell/short signal! The clues were all there that it would be a great short!

Carvana (CVNA.K) Used car sales Carvana down more than 90% since the cloud chart sell/short signal!

 The clues were all there that it would be a great short:

 1)  First the business model: "mutton dressed as lamb" when management claiming that Carvana is the Amazon of cars and still just peddling used cars but doing it online, but trying to dress it up as a unique new business model. Particular problem with CEO's of a certain age and experience! 

 2)  There is a convicted fraudster very involved in the business, so there is significant risk in the business! There is generally a high level of repeat offending with criminals, so there is that risk too. 

 3)  The use of creative accounting to manipulate the financials of the company was another tell sign. 

 4)  High levels of insider selling in young unprofitable IPO's was another tell sign! 

 5)  And as we all know that just like one can never trust bankers or politicians you can never trust a used car salesman! 

 You can always bet on human nature! What a great short! The Carvana con!

Tuesday, 26 July 2022

TSLA: Up 28% since rebounding from old cloud chart support zones! Next resistance zones: 856/886!

TSLA: Up 28% since rebounding from old cloud chart support zones! Now digging deeper into cloud chart resistance with the next resistance zones: 856/886 at the top end cloud chart resistance zones! Need to see a breakout past these levels for the cloud chart to be bullish! But so far the cloud chart rebound swing trades have worked out well.

Thursday, 21 July 2022

EURUSD up more than 234 points since the cloud chart buy signal! So far so good!

EURUSD up more than 234 points since the cloud chart buy signal on the 60 min cloud chart! So far so good! EURUSD up more than 234 points since the cloud chart cross buy signal. Next key resistance zones are 1.0305 to 1.0348! Top end of the cloud is a new support zone!

Wednesday, 20 July 2022

WTI Light Crude Trade: Great rebound from $91 support zone, now fighting a key resistance zone at $104!

WTI Light Crude Trade: Great rebound from $91 support zone, now fighting a key resistance zone at $104! Great trade as WTI rebounded from the 91.28 cloud chart support zone! Now fighting resistance zone at the bottom end of the cloud chart level of 104.76! Testing support at front cloud support zone 102.48 with bottom end of the cloud as the next major resistance zones of 107.14/108.28 if WTI can break past 104.76 resistance level! WTI not out the woods yet since price action is below the cloud.

Monday, 18 July 2022

Nasdaq 100 E-mini Futures AI trades up by more than 1500 points using AI!

Nasdaq 100 E-mini Futures AI trades up by more than 1500 points using AI over the last few weeks! Some great trades on the e-minis, last three AI generated trades up 477 points (+4.11%) 445 points (3.86) and 606 points (+5.25%). Winning with AI!
For more info on this AI go to: www.metastock.com/fulgenta

BTCUSD up 17% since the AI buy signal on 4H chart! So far so good winning with AI!

BTCUSD up 17% since the Artificial Intelligence (AI) buy signal on the 4 hour chart. The two most recent trades up 17% and 8% since the AI generated buy signals!So far so good winning with AI!
https://www.metastock.com/alphaharvest3for1

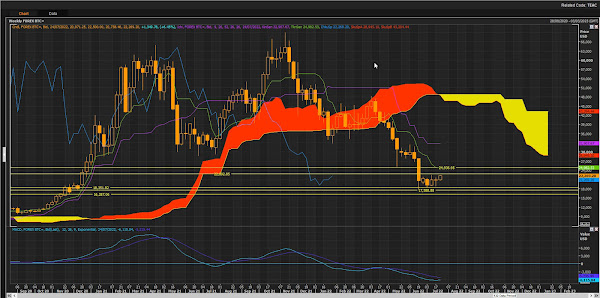
BTCUSD: Rebounding from key support zones! Next resistance zones: 22892/24936!

BTCUSD: Rebounding from key support zones! Next resistance zones: 22892/24936! So far so good. BTC rebounded from key cloud chart support zone of 17588 between a cluster of support zones: 16287/18351! Next key resistance zones are the cloud chart level of 22892 and the next level that could be tested is 24936 resistance zone the green turning line level of the cloud on the weekly cloud chart!
On the daily cloud chart BTC is on its way to fight the bottom end cloud chart resistance zone after rebounding from a key support zone at 17588! Now needs to break out past the 22892 and the next level of the front end of the cloud at 24982 to close back above the top end cloud chart level for a new bull rally to be confirmed. Price action above the cloud is bullish, price action below the cloud is bearish! Looking out for that key cloud chart breakout!

Wednesday, 13 July 2022

S&P500 Index: Fighting hard to rebound from key Cloud Chart support zones!

Coinbase (COIN.O) Down more than 88% since the cloud chart sell/short signal!

Coinbase (COIN.O) Down more than 88% since the cloud chart sell/short signal! Now Coin is floating above the $45 support zone! Easy money been made, now out of the short for now! Bottom end of the cloud is a key resistance zone! For a new uptrend to resume in Coin it needs to break out back above the cloud chart resistance zone!
https://www.metastock.com/alphaharvest3for1

Tuesday, 12 July 2022

Monday, 11 July 2022

EURUSD: Fighting hard for support at a major monthly cloud chart support zone:1.0081!

EURUSD: Fighting hard for support at a major monthly cloud chart support zone:1.0081! If support fails at this level there is downside risk to 0.9299/0.8991! The Euro is down more than 16% since the most recent cloud chart sell signal!

EURUSD: Downside risk to 1.00 and 0.93/0.92 on a P&F chart basis!

EURUSD: Downside risk to 1.00 and 0.93/0.92 on a P&F chart basis! Beware any P&F chart reversals to the upside to signal the end of the current downtrend! EURUSD down more than 15% since the P&F chart sell signal!

GBPUSD: Dangerously close to activating the next major P&F chart target of 1.08! Downside risk to the next closest target 1.18!

GBPUSD: Dangerously close to activating the next major P&F chart target of 1.08! Recently GBPUSD hit the downside point and figure chart targets of 1.23 and 1.21! Beware any P&F chart reversal to the upside to signal the end of the current downtrend! Downside risk to the next closest target 1.18! GBP down more than 14% since the P&F sell signal and is still locked in a P&F downtrend.

Wednesday, 6 July 2022

Brent Crude Down +15% since the Cloud Chart Sell signal at 118! Next key support zone 96.77!

Brent Crude Down +15% since the Cloud Chart Sell signal at 118! Next key support zone 96.77! Brent crude failed to maintain support at the bottom end of the cloud level of 111.44! Brent is down more than 15% since the cloud chart sell signal above the cloud and this level was also close to the front cloud resistance zone of 118! Next key support zones to be tested is around the 96.77 level! Price action below the cloud is bearish!

WTI Down 14% since the Cloud Chart sell signal! Next key support zones: 93.82/91.28!

WTI Down 14% since the Cloud Chart sell signal! Next key support zones to be tested: 93.82/91.28! WTI attempted to rebound from a cloud chart support zone at the bottom end of the cloud at 104.76 but this support level did not hold! When WTI sliced past this key level to trade below the cloud the outlook changed from bullish to bearish on the daily cloud chart. WTI is down more than 14% since the cloud chart sell signal at around the $110 zone!

Tuesday, 5 July 2022

S&P500 Index Futures Back in bearish outlook with price action below the key cloud chart levels!

S&P500 Index Futures Back in bearish outlook with price action below the key cloud chart levels! S&P500 index futures lost support at the bottom end of the cloud. If they index keeps trading below this critical cloud chart support zone this week then the outlook remains bearish on the 60M and 4 Hour cloud charts! Long-term outlook on the daily and weekly remains bearish since price action is below the cloud levels on those two charts and has been so since April! Need to see support come in at these short-term time frames for a recovery to take place! Downside risk remain high!

EURUSD down more than 1800 points since the major cloud chart sell signal! Lagarde short trade gift that keeps on giving!

EURUSD down more than 1800 points (-15%) since the major cloud chart sell signal! Lagarde short trade gift that keeps on giving!
EURUSD heading closer to a major monthly cloud chart support zone of 1.0268 and 1.0081!
And here a great quote by Lagarde: "Extraordinary times require extraordinary action. There are no limits to our commitment to the euro. We are determined to use the full potential of our tools, within our mandate." - Christine Lagarde

Monday, 4 July 2022

WTI Light Crude Oil Rebounded from the 104 cloud chart support zone!

WTI Light Crude Oil Rebounded from the 104 cloud chart support zone! As long as oil trades above the top end of the cloud the outlook is bullish! Two resistance zones above the cloud is the front cloud chart level of 115, and then the old high of 123!

EURUSD Down more than 900 points (-8.3%)since the cloud chart sell signal!

EURUSD Down more than 900 points since the cloud chart sell signal! Price action below the cloud remains bearish, with the bottom end of the cloud as a major resistance zone on the daily cloud chart!
The euro is down more than 1600 points (-13.9%) since the major cloud chart sell signal above the cloud!

GBPUSD: "The Bailey Short" generated more than 1400 points shorting GBP before the 10% drop!

GBPUSD: "The Bailey Short" generated more than 1400 points shorting GBP since the most recent major cloud chart sell signal on the daily cloud! GBP down more than 10% since the cloud chart sell signal! Always a good idea to capitalise on the "competence" of central bankers!
Price action below the cloud remains bearish with the bottom end cloud chart levels as key resistance zones!