Tuesday, 11 October 2022

Nasdaq Composite Fighting hard for support at 10408 cloud chart support zone! Downside risk to 9346 on the cloud chart!

 Nasdaq Composite fighting hard for support at 10408 cloud chart support zone! Downside risk to 9346 on the cloud chart if support fails at key cloud chart levels! Short-term rebound swing trades possible from key cloud chart support zones!


Price action is below the cloud and this is bearish long-term!

Thursday, 6 October 2022

CLc1: Light Crude up more than 15% since the cloud chart support zone rebound at $77/$76. Next resistance zones of $89/$90 & $92!

 CLc1: Light Crude up more than 15% since the cloud chart support zone rebound at $77/$76.

On its was to the bottom end cloud chart resistance zones of $89/$90 & $92 zones!


Wednesday, 5 October 2022

Xetra Dax Rebounded from a major cloud chart support zone 12017! Upside resistance targets 12713/12905/13168 for the Q4 rally!

 Xetra Dax Rebounded from a major cloud chart support zone 12017! Upside resistance targets 12713/12905/13168 for the Q4 rally!

Xetra Dax managed to find support at the front end of the monthly cloud chart level of 12264/12017! Upside resistance zones 13318/13940!


On the daily cloud chart key resistance zones are turning line of the cloud at 12713 then towards the top end of the front end of the cloud at 12905/13168. A relief rally in an over bearish cloud chart! 


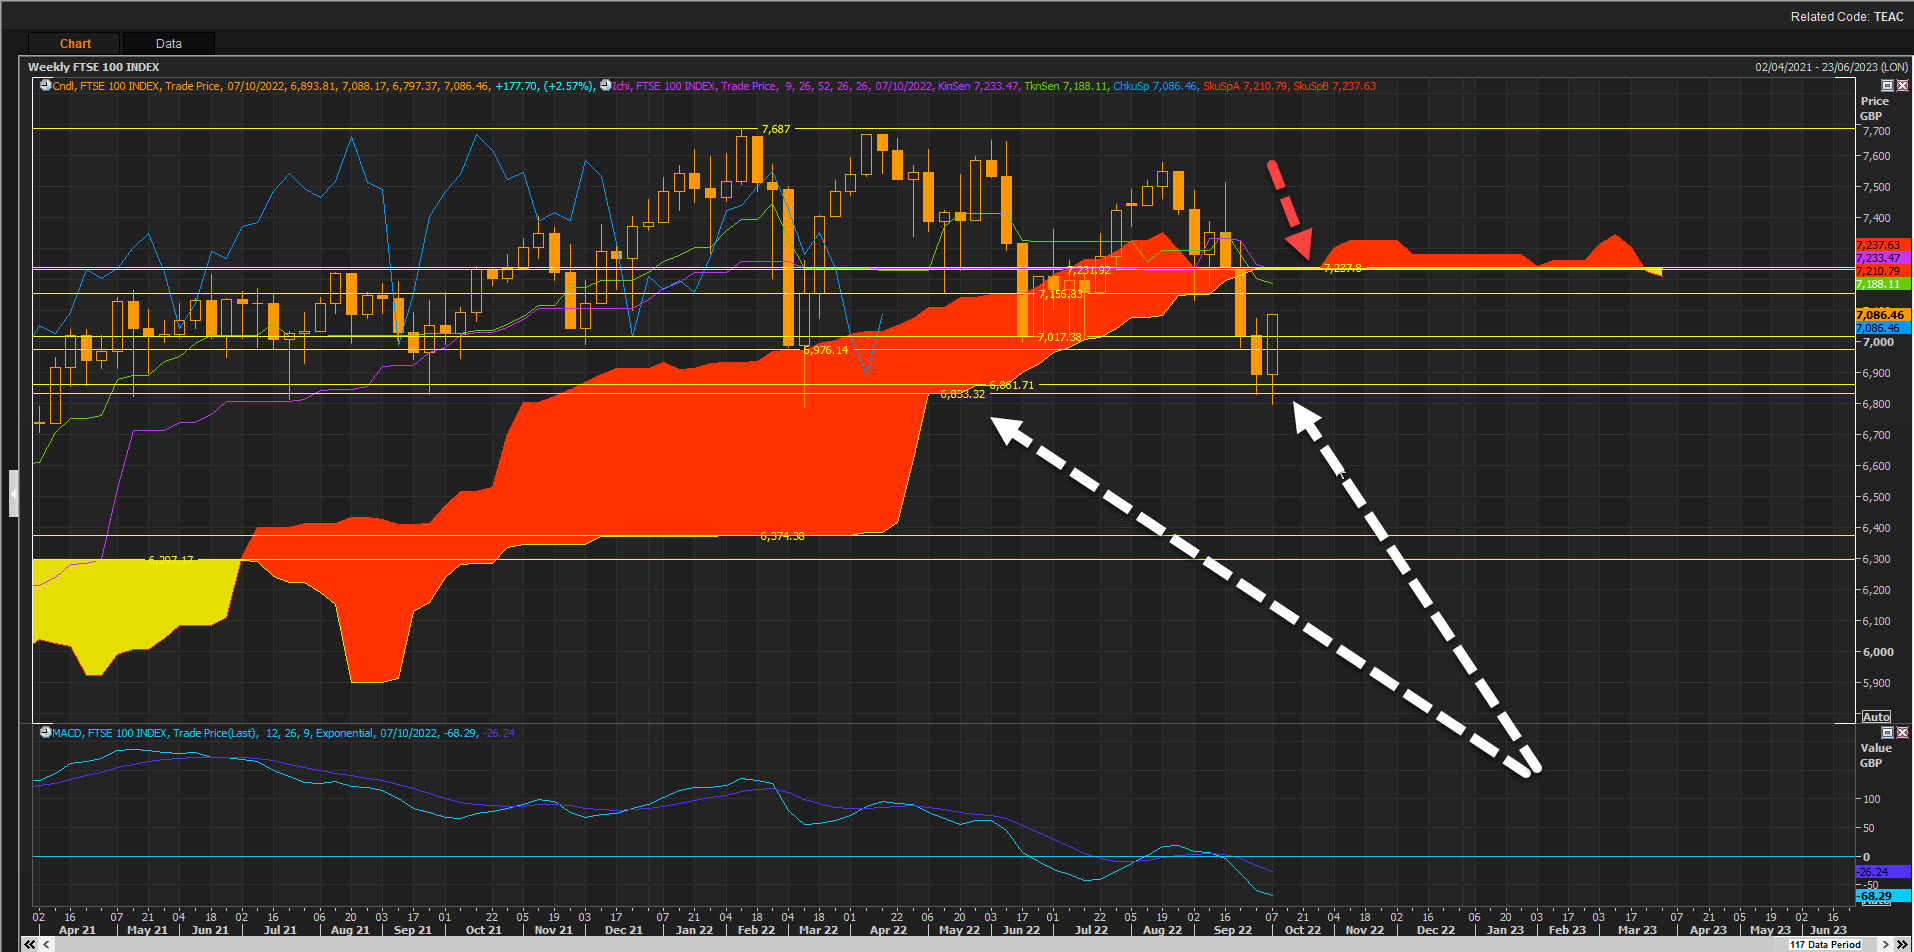
FTSE100: Rebounded from 6833 cloud chart support zone! Upside resistance targets: 7156/7237!

 FTSE100: Rebounded from 6833 cloud chart support zone! Upside resistance targets: 7156/7237 the bottom end of the weekly cloud chart! FTSE needs to break past the cloud chart resistance to be back in bullish outlook. Price action below the cloud remains bearish. Swing trade rebound from the 6861/6833 old cloud chart support zone worked out well.


On the daily cloud chart the next key resistance zones are the front end of the cloud at 7086, the bottom end of old cloud chart support at 7164/7240 with the upside resistance target at 7291 as the Q4 seasonal rally is starting to take off now.  


Monday, 3 October 2022

AAPL: On its way to test support zones of 138/129. Down more than 18% since the sell signal!

 AAPL: On its way to test support zones of 138/129. Down more than 18% since the sell signal!

Apples are going off since AAPL sliced past the bottom end cloud chart support zone and then entered a bearish outlook. Price action below the cloud is bearish.

On its way to test old cloud chart support levels at the bottom end of the cloud at 138 and with more downside risk to the June low of 129! Swing trade rebound potential from key support levels back up to the bottom of the cloud if support holds at these support zones! 


Nasdaq Comp Index: 3rd Wave FOMOFED POWELL Power Bear Market Rally towar...